GMKtec M7 Ultra (Ryzen 7 PRO 6850U, 32GB)
relatedOwned
⚠This site is under active development. Some features may not work as expected, and new content is being added regularly.
.png)
You have monitors watching your services and notifications telling you when something breaks. That covers the essentials. But Uptime Kuma has a lot more to offer — features that take your monitoring from "it works" to "it works well."
In this final part, we'll organize your dashboard with groups and tags, set up a public status page, create maintenance windows to suppress alerts during planned work, add certificate expiry tracking, and solve the biggest question in monitoring: who watches the watchman?
Before starting, you'll need:
With 5 monitors, the flat list is manageable. With 20 or 50, it's chaos. Groups let you organize monitors by function and collapse them on the dashboard.
Click Add New Monitor and set Monitor Type to Group. Name it something descriptive — we'll use "Web Server (tut-web)" since all our tut-web monitors logically belong together.
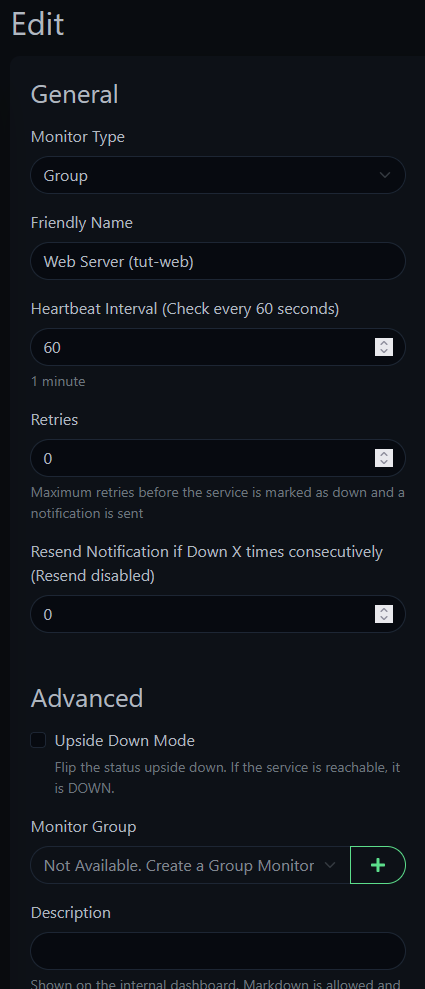
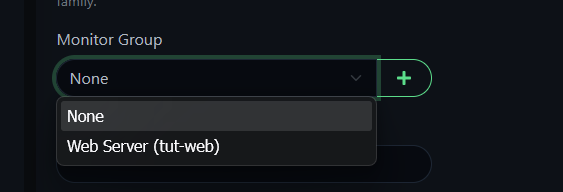
Now edit each tut-web monitor (Ping, HTTP, Keyword, TCP Port), scroll down to Monitor Group, and select the group you just created.
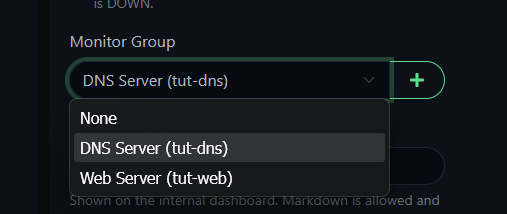
Create a second group — "DNS Server (tut-dns)" — and move the DNS monitor into it.
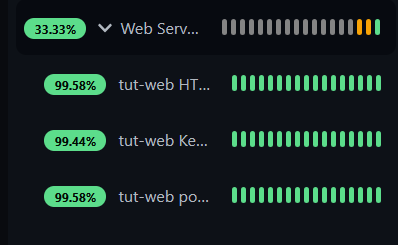
Your dashboard now shows collapsible groups instead of a flat list. Click the arrow to expand and see individual monitors.
TIP
Groups don't need their own notifications — the individual monitors inside already have Pushover and Discord enabled from Part 2. Adding notifications to the group itself would just create duplicate alerts.
Tags let you visually categorize monitors with colored badges. They're most useful when you have dozens of monitors and want to filter by category.
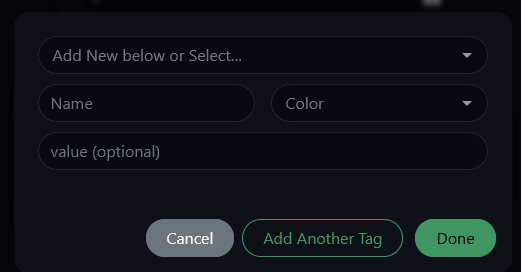
Edit any monitor, scroll to the Tags section, and click to create a new tag. Give it a name (like "Critical") and a color. The Value field is optional — useful for extra context like a port number, but not required.
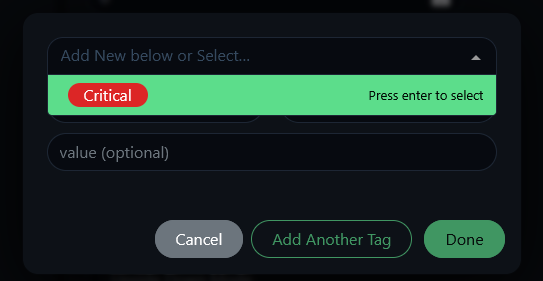
Tags are reusable — once created, they appear in the dropdown for any monitor. Apply them to whichever monitors make sense.
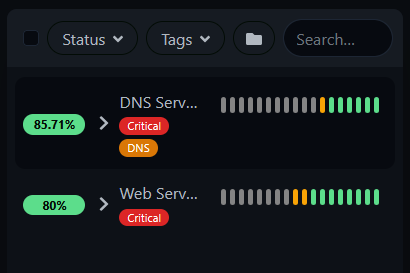
Your dashboard now shows tag badges next to monitor groups, making it easy to spot what matters at a glance.
If you run any HTTPS services — and if you use a reverse proxy like Caddy, you do — you should know when certificates are about to expire. Uptime Kuma tracks this automatically for any HTTPS monitor.
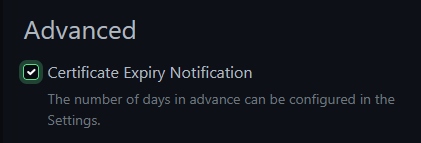
Add an HTTPS monitor for a service behind your reverse proxy. We'll use Pi-hole (https://pihole.hake.rodeo/admin/) as the example — substitute any HTTPS service on your network. In the monitor settings under Advanced, check Certificate Expiry Notification.
To see the feature in action with a public site, add a second HTTPS monitor for https://github.com with the same settings. Compare the two — GitHub shows a clean certificate expiry date:
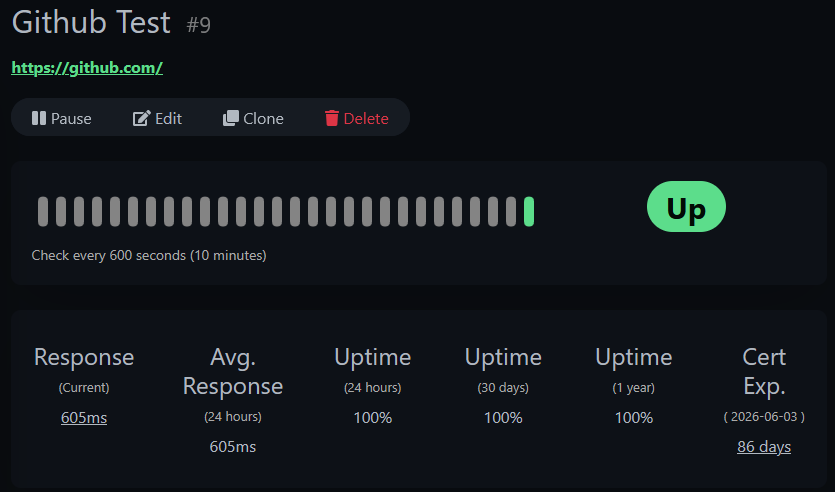
Your local service through the reverse proxy shows both certificate expiry and domain expiry:
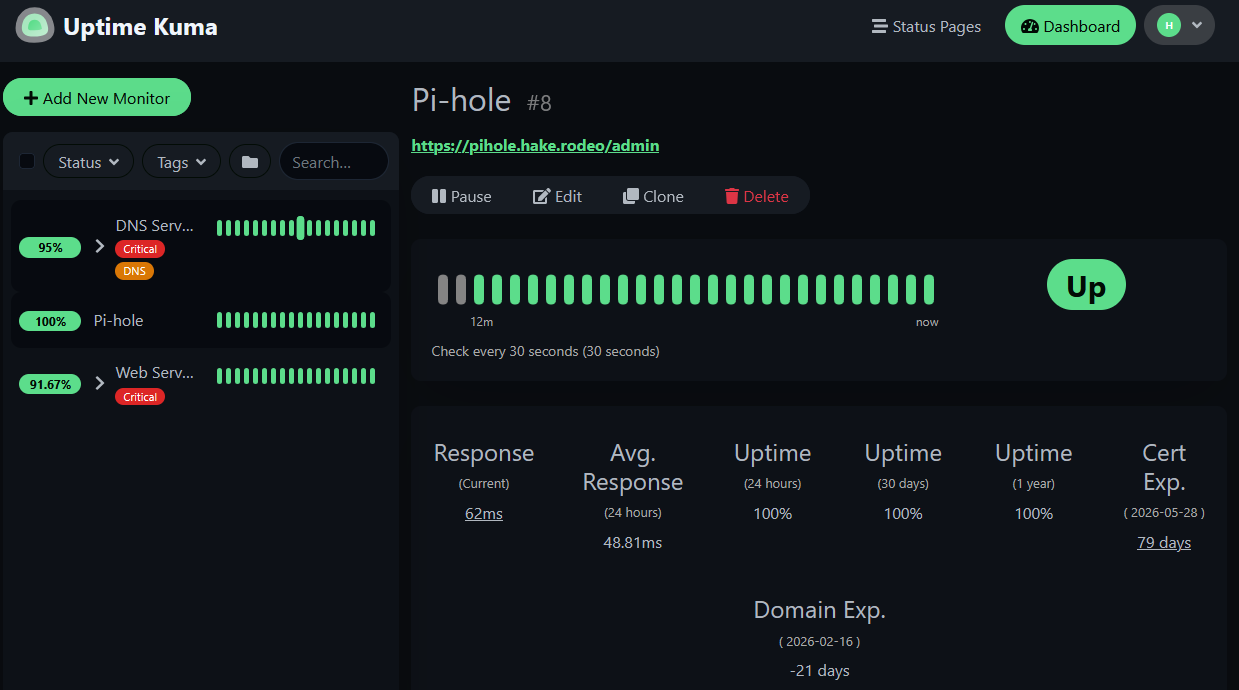
NOTE
You might see a negative number for Domain Exp. — this is the domain registration expiry, not the TLS certificate. For domains managed by Cloudflare or your registrar, this data may not be meaningful. The Cert Exp. line is what matters for TLS.
WARNING
If your reverse proxy renews a certificate (Caddy does this automatically), Uptime Kuma may cache the old certificate's expiry date. If Cert Exp. shows a suspicious number, toggle the Certificate Expiry Notification checkbox off and back on to force a refresh.
Status pages give anyone a read-only view of your service health — no login required. Great for family members or roommates who use your homelab services and want to check if things are up without asking you.
Click Status Pages in the top navigation bar (not the sidebar).
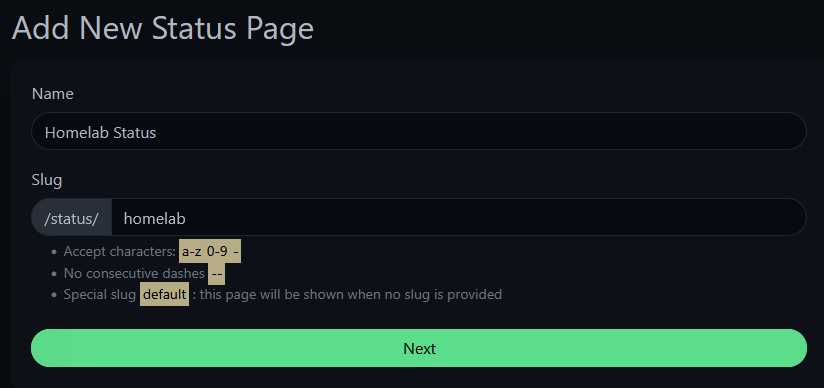
Click New Status Page. Give it a name and slug — the slug becomes the URL path.
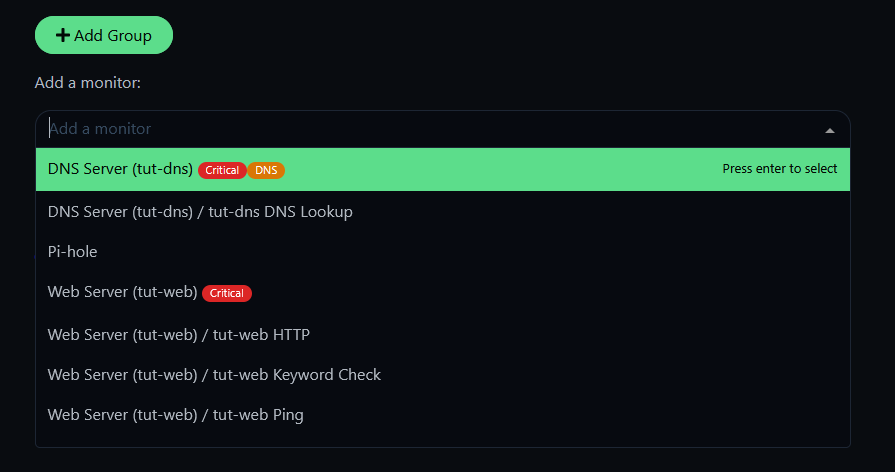
On the editor, add groups and assign monitors to them. You can select individual monitors or entire monitor groups.
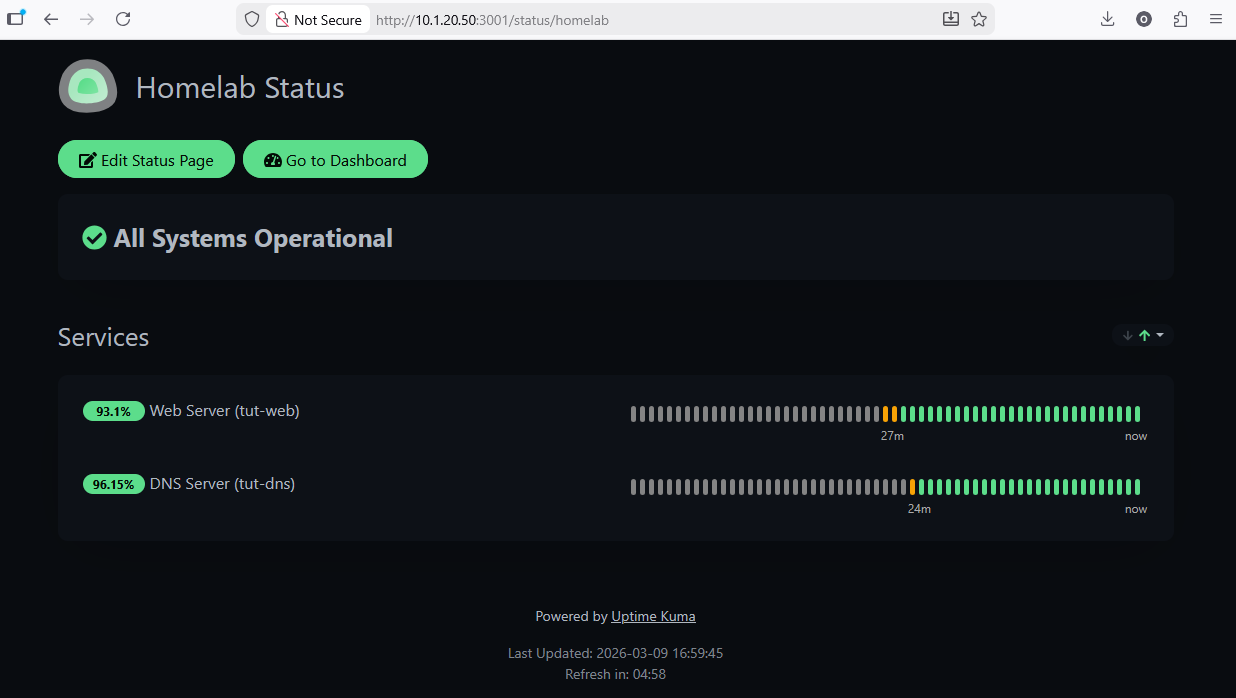
Click Save and visit your status page at http://<your-kuma-ip>:3001/status/homelab.
When you're logged in, you'll see edit controls:
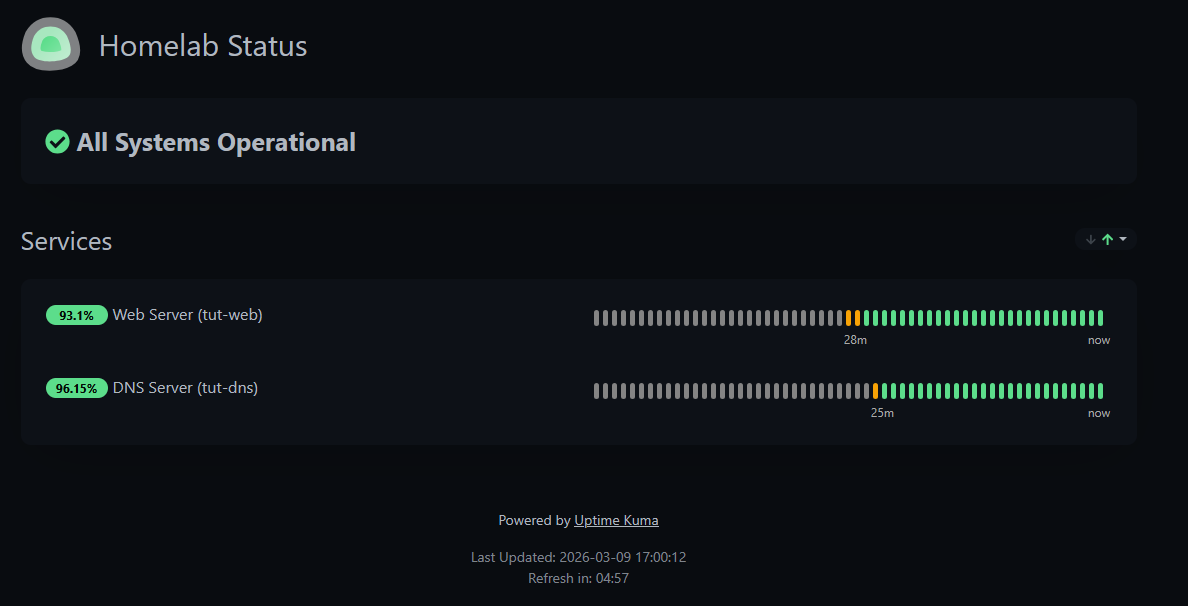
Open the same URL in a private/incognito tab to see what others see — a clean, read-only status dashboard:
When you're doing planned work — upgrading a service, rebooting a host, swapping a drive — you don't want your phone blowing up with alerts for downtime you caused. Maintenance windows suppress notifications for selected monitors during planned work.
Click your username and select Maintenance.
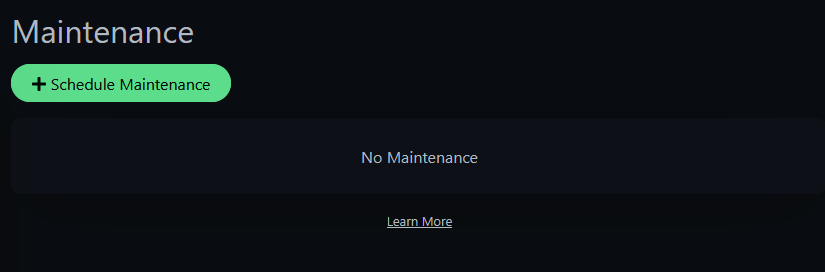
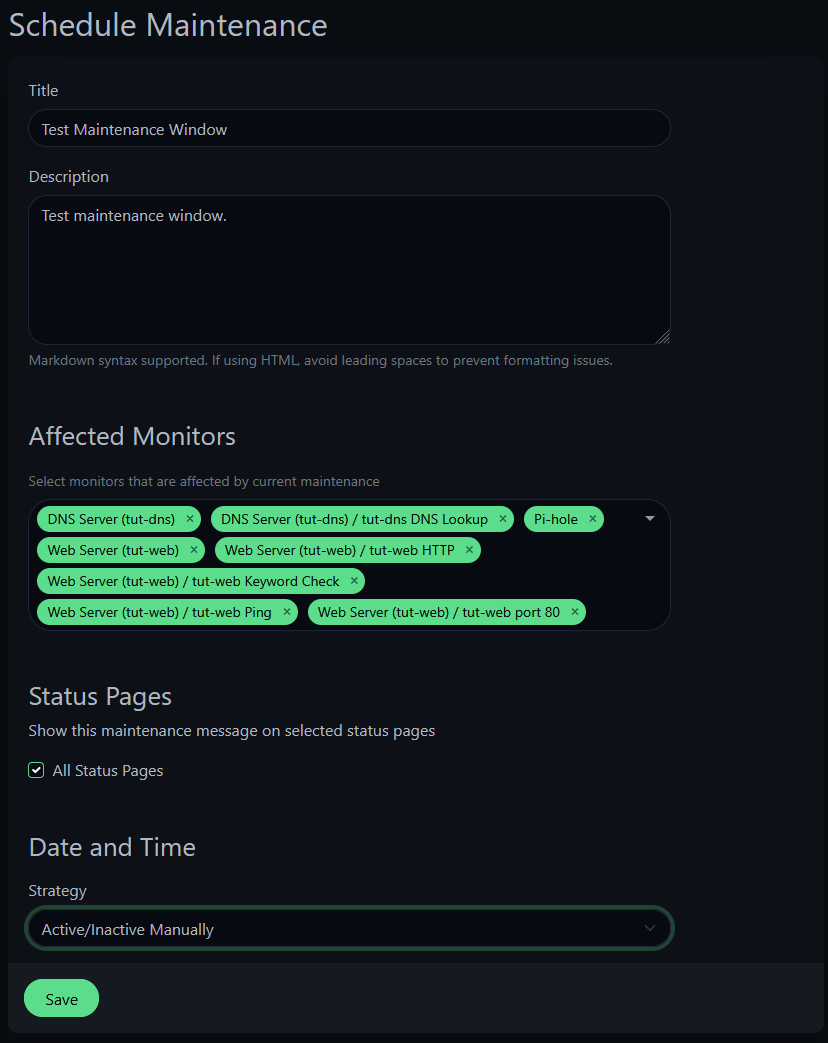
Click Schedule Maintenance and configure:
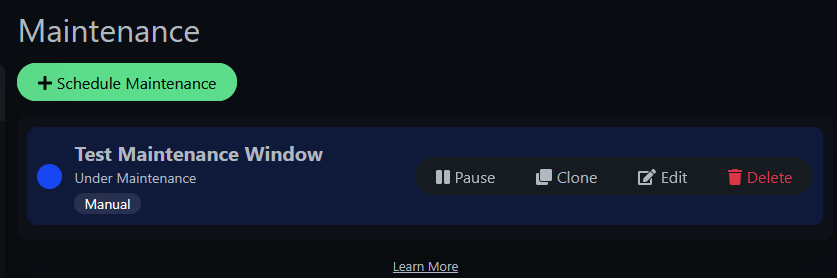
Once saved and active, you'll see it in the maintenance list with Pause/Edit/Delete controls.
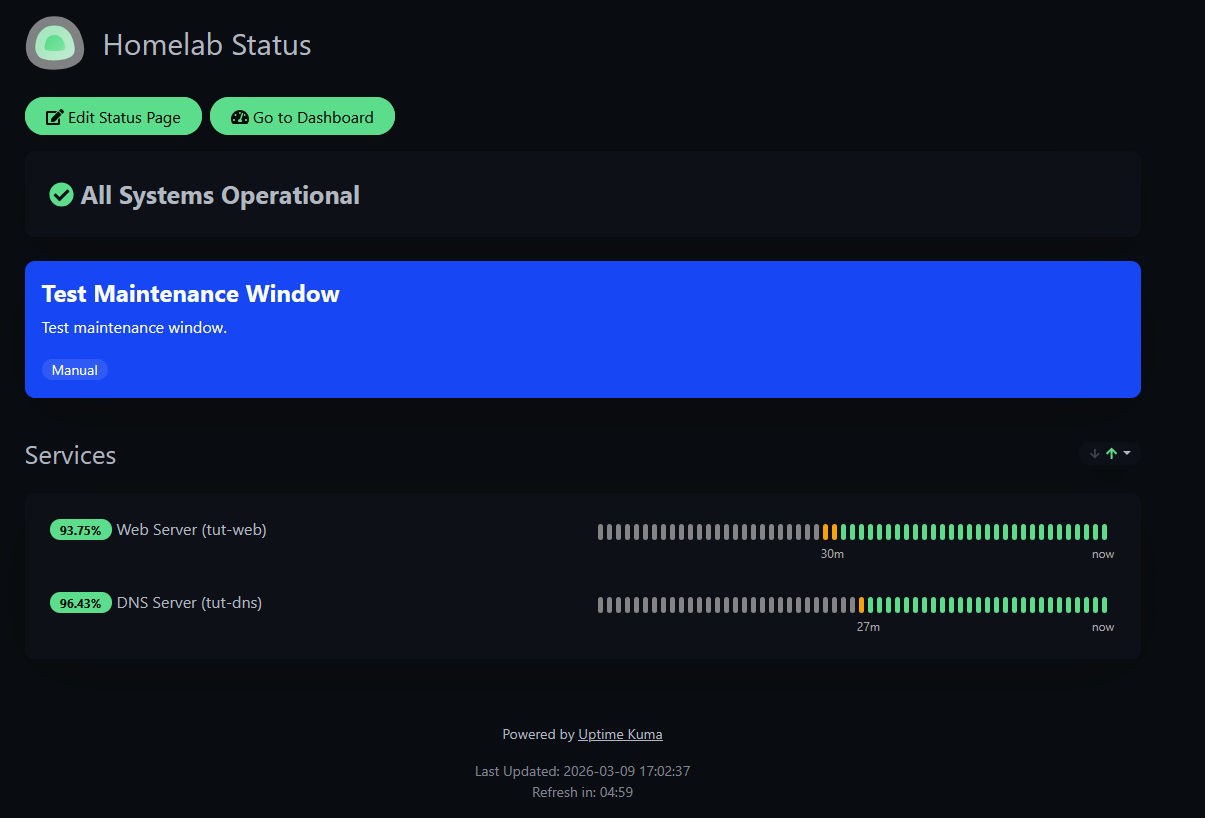
And your status page shows a blue banner letting visitors know maintenance is in progress:
With maintenance active, monitors still track status but notifications are suppressed. No phone buzzing at 2 AM during planned upgrades. When you're done, just pause or delete the maintenance window and notifications resume.
TIP
The "Manual" strategy is perfect for homelab work where you don't know exactly when you'll start and finish. For recurring maintenance (like weekly backup windows), use the "Recurring" strategy with a cron schedule.
There's a fundamental problem with self-hosted monitoring: if Uptime Kuma goes down — or the entire Proxmox host goes down — nobody gets notified. The monitoring tool can't alert you about its own death.
The solution: an external service that expects a heartbeat from Uptime Kuma at regular intervals. If the heartbeat stops, the external service alerts you. Healthchecks.io does exactly this, and the free tier (20 checks) is more than enough.
Sign up at healthchecks.io and create a new check.
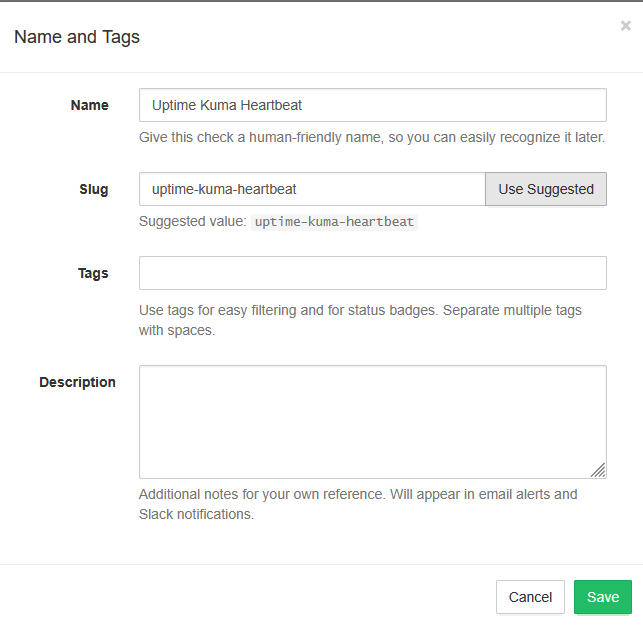
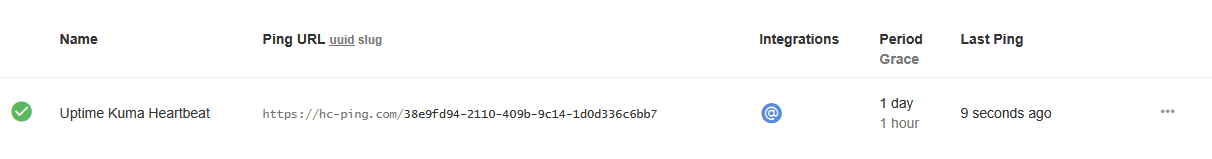
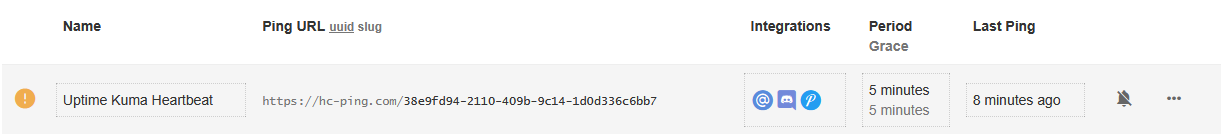
Name it "Uptime Kuma Heartbeat" and save. You'll get a unique ping URL — copy this.
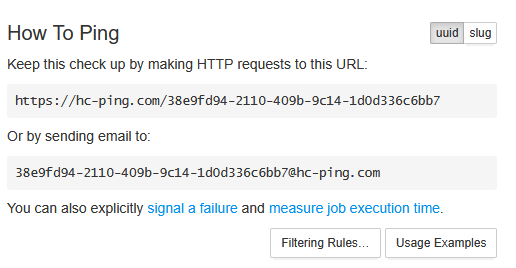
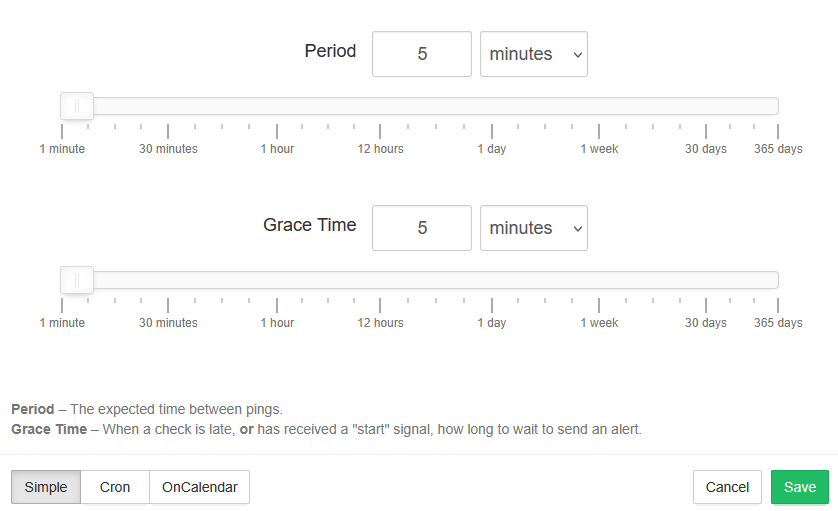
Before doing anything else, set the Period and Grace values. Period is how often you expect a heartbeat ping. Grace is how long to wait after a missed ping before alerting. Set both to 5 minutes.
WARNING
The default Period is 1 day with a 1-hour Grace. If you don't change these before testing, you'll be waiting over 25 hours for an alert. Set them to 5 minutes first.
Go to Integrations in Healthchecks.io. You'll see a list of available services.
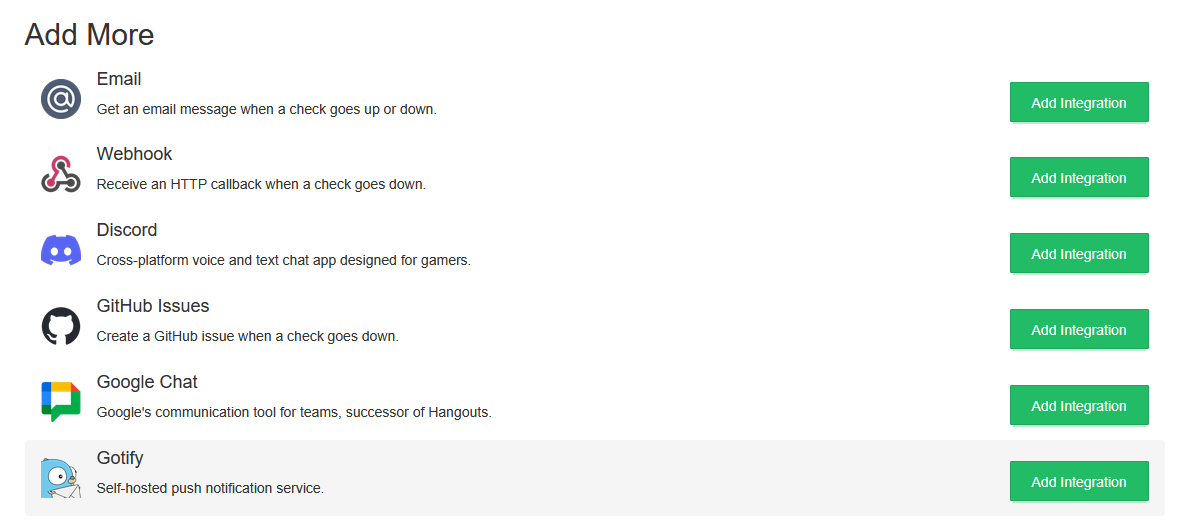
For Discord: Click Add Integration next to Discord. Use the native Discord integration (OAuth-based) — it connects directly to your Discord server.
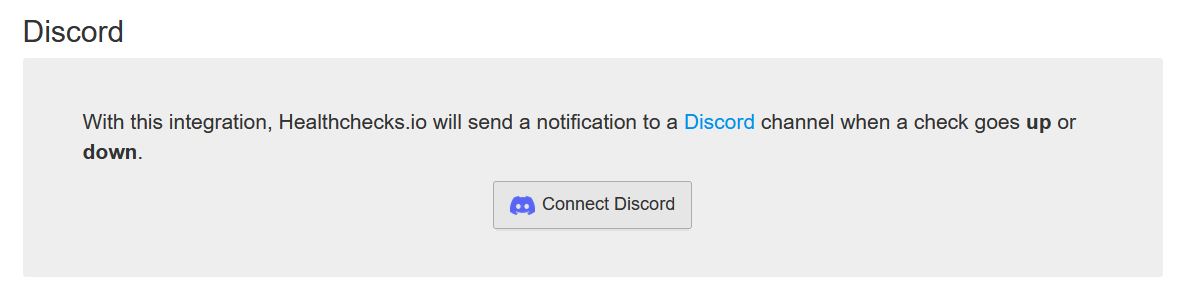
You'll be redirected to Discord to authorize the connection. Select your server and channel.
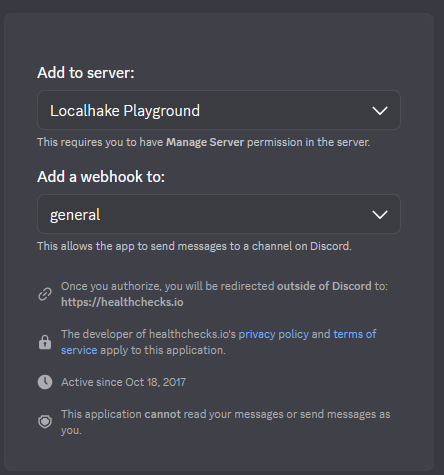
WARNING
Do NOT use the generic "Webhook" integration with a Discord webhook URL — it sends a different payload format and won't work. Use the native Discord integration (the one with the Discord logo and OAuth).
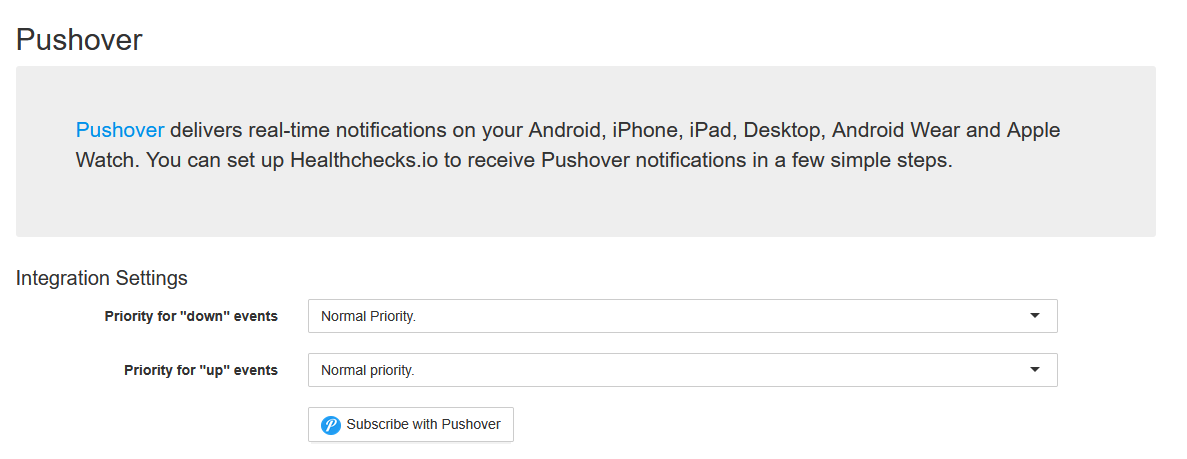
For Pushover: Click Add Integration next to Pushover. It uses Pushover's native subscription flow — click "Subscribe with Pushover" and it connects automatically.
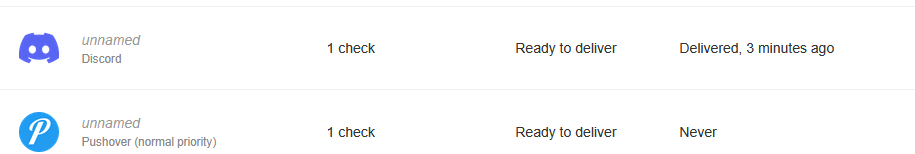
Once both are connected, your integrations list should show Discord and Pushover ready to deliver:
Now we'll set up a cron job on the Uptime Kuma container that pings Healthchecks.io every 5 minutes. If Kuma (or the host) goes down, the pings stop, and Healthchecks.io alerts you.
SSH into your Proxmox host and enter the Kuma container:
pct enter 150Install the cron job — replace <your-uuid> with the UUID from your Healthchecks.io ping URL:
echo "*/5 * * * * curl -fsS -m 10 --retry 5 https://hc-ping.com/<your-uuid> > /dev/null 2>&1" | crontab -Quick breakdown of the curl flags:
-fsS — fail silently on HTTP errors, show errors on stderr-m 10 — 10-second timeout so a hung request doesn't block the next cron run--retry 5 — retry up to 5 times on transient failures> /dev/null 2>&1 — no local logging neededVerify the cron job is installed:
crontab -lSend a manual ping to confirm connectivity:
curl -fsS -m 10 https://hc-ping.com/<your-uuid>You should see OK. Check Healthchecks.io — your check should flip to green.
We need to prove this works. Remove the cron job to simulate Kuma going offline:
crontab -rcrontab -lYou should see "no crontab for root".
Now wait. After ~10 minutes (5 min period + 5 min grace), Healthchecks.io detects the missing heartbeat. First it goes to a warning state:
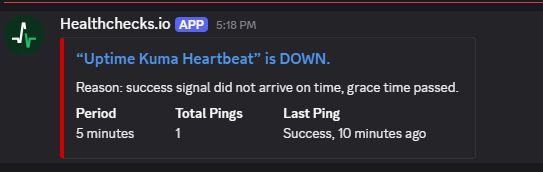
Then the alerts fire. Discord gets the notification from the Healthchecks.io bot:
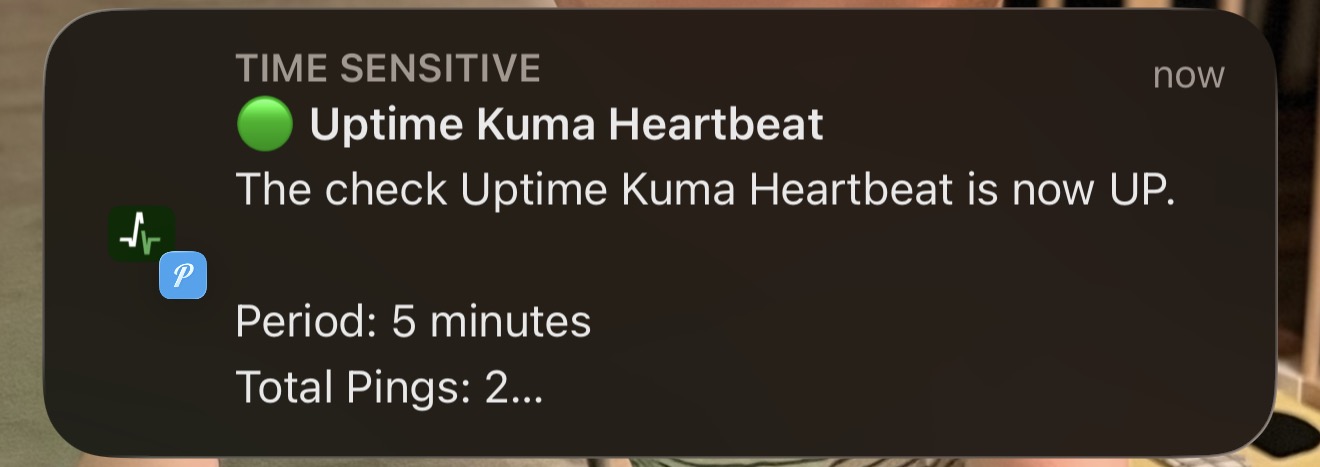
And Pushover hits your phone:
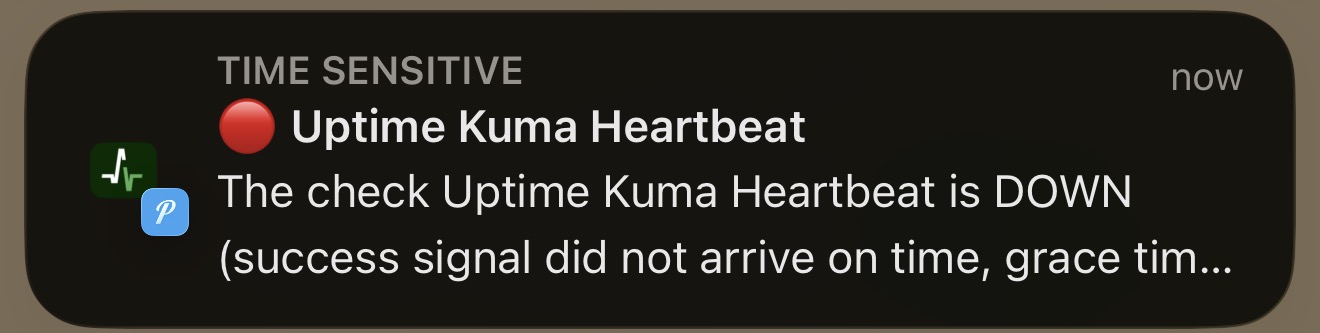
That's the watchman working. If your Proxmox host crashes, the container dies, or Uptime Kuma hangs — the heartbeat pings stop and you find out within 10 minutes from an external service that has nothing to do with your infrastructure.
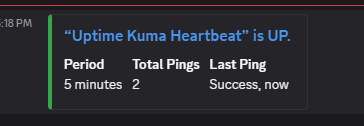
Reinstall the cron job and send an immediate ping to recover:
echo "*/5 * * * * curl -fsS -m 10 --retry 5 https://hc-ping.com/<your-uuid> > /dev/null 2>&1" | crontab -
curl -fsS -m 10 https://hc-ping.com/<your-uuid>
Healthchecks.io flips back to green and sends recovery notifications on both channels.
If you run services behind a reverse proxy like Caddy, there's a monitoring pattern worth adopting. We already set up an HTTPS monitor through Caddy in Step 3 — here's the full picture.
Three layers of monitoring per proxied service:
| Layer | What to monitor | What it tells you |
|---|---|---|
| Caddy itself | HTTP or TCP check on Caddy's IP/port | "Is the proxy alive?" |
| Through Caddy | HTTPS monitor on the proxied URL (e.g., https://vault.yourdomain.com) | "Is the full chain working?" (DNS, TLS, proxy, service) |
| Direct IP | HTTP or TCP on the service's internal IP/port | "Is the service itself alive?" |
Why both URL and direct IP? Fault isolation:
| Through Caddy | Direct IP | Caddy monitor | Diagnosis |
|---|---|---|---|
| Down | Down | Up | The service itself is down |
| Down | Up | Up | Bad proxy config or cert issue for that domain |
| Down | Up | Down | Caddy is down — all proxied services affected |
| Up | Up | Up | Everything is fine |
We already set up the "through Caddy" monitor in Step 3. To complete the pattern, you'd add a direct monitor for the service (e.g., http://10.1.99.100/admin/ for Pi-hole) and a monitor for Caddy itself. This isn't required for the tutorial, but it's how you'd set up production monitoring.
Certificate expiry showing wrong or negative numbers? Uptime Kuma caches certificate data. If your reverse proxy renewed the cert, toggle the "Certificate Expiry Notification" checkbox off and back on to force a refresh.
Healthchecks.io "Webhook" integration not working with Discord? The generic Webhook sends a different payload than Discord expects. Use the native Discord integration (OAuth-based), not the generic Webhook option.
Healthchecks.io taking forever to alert? Check your Period and Grace settings. The default is 1 day + 1 hour — set both to 5 minutes for practical homelab use.
Domain Exp. showing negative days? That's domain registration expiry, not TLS certificate expiry. For domains managed by Cloudflare, this is often inaccurate. Focus on Cert Exp. instead.
Across all three parts, you now have:
Part 1 — Foundation:
Part 2 — Notifications:
Part 3 — Advanced:
Your homelab monitoring is now more capable than what many small businesses have. Every service is watched, every failure is reported, and even the monitoring tool itself is monitored.
Some links are affiliate links. I may earn a small commission at no extra cost to you.