
Install Paperless-ngx on Proxmox LXC (2026)
April 22, 2026Tutorial
⚠This site is under active development. Some features may not work as expected, and new content is being added regularly.
.png)
Your homelab is running a dozen services — reverse proxy, DNS, file server, media stack — and you have no idea when one of them goes down until you try to use it. Uptime Kuma fixes that. It's a self-hosted monitoring tool that watches your services and tells you when something breaks.
In this tutorial, we'll install Uptime Kuma on a Proxmox LXC container, set up five different monitor types, and then intentionally break things to see how each monitor responds. By the end, you'll understand exactly which monitor type to use for each service in your homelab.
Before starting, you'll need:
We're using two test containers on VLAN 20 (a lab/testing VLAN) as monitoring targets — an nginx web server at 10.1.20.51 and a dnsmasq DNS resolver at 10.1.20.52. You can substitute any services on your own network.
SSH into your Proxmox host and check which Debian 13 template is available:
pveam available --section system | grep debian-13Download the template to your local storage:
pveam download local debian-13-standard_13.1-2_amd64.tar.zstIf you've already downloaded it, the command will tell you — no harm in running it again. You can verify what's on your local storage with:
pveam list localThis is the one step where your setup will differ from ours. The command below creates a container on our network — you'll need to adjust several values to match yours.
Here's what we're using:
pct create 150 local:vztmpl/debian-13-standard_13.1-2_amd64.tar.zst \
  --hostname tut-kuma \
  --cores 2 \
  --memory 2048 \
  --rootfs local-lvm:8 \
  --net0 name=eth0,bridge=vmbr0,tag=20,ip=10.1.20.50/24,gw=10.1.20.1 \
  --nameserver 10.1.99.100 \
  --unprivileged 1 \
  --features nesting=1 \
  --start 1
What you'll likely need to change:
| Parameter | Our value | What to use instead |
|---|---|---|
150 (CT ID) | 150 | Any unused CT ID on your Proxmox host |
ip=10.1.20.50/24 | 10.1.20.50 | A free IP on your network (e.g., 192.168.1.50/24) |
gw=10.1.20.1 | 10.1.20.1 | Your network's gateway (e.g., 192.168.1.1) |
tag=20 | VLAN 20 | Remove this entirely unless you use VLANs. We use VLAN 20 for our lab network — most home networks don't use VLANs at all. |
--nameserver 10.1.99.100 | Our Pi-hole | Your DNS server IP, or your gateway IP if you don't run a separate DNS server |
What you should keep as-is:
| Parameter | Why |
|---|---|
--cores 2 --memory 2048 | 2 cores and 2GB RAM is comfortable for Uptime Kuma. You can go lower (1 core, 512MB) for a small homelab. |
--rootfs local-lvm:8 | 8GB disk is plenty. Adjust the storage name if yours isn't local-lvm. |
--unprivileged 1 | Security best practice — runs the container without root-level host privileges. |
--features nesting=1 | Required for Debian 13 — systemd 257 needs this or you'll get errors. |
--start 1 | Starts the container immediately after creation. |
--hostname tut-kuma | You can change this to whatever you want — uptime-kuma, monitoring, etc. |
Not sure about your gateway? Run
ip routeon your Proxmox host — look for the line starting withdefault via. That's your gateway IP. Your container should be on the same subnet.
Don't use VLANs? Just remove
tag=20from the--net0line. VLANs are for network segmentation — if you haven't set them up, your Proxmox host and containers are all on the same network and no VLAN tag is needed.
You should see output showing the template being extracted, SSH keys being generated, and the container starting. You may see some systemd nesting warnings — these are informational and safe to ignore since we already included --features nesting=1.
From here on, everything is the same regardless of your network setup. Enter the container:
pct enter 150Use your CT ID — if you used a different number than 150, replace it here.
Install curl and git — the base Debian 13 template doesn't include curl, which we need for the NodeSource setup:
apt-get update && apt-get install -y curl gitWhy not just
apt install nodejs? Debian 13 ships Node.js 20, which technically meets Uptime Kuma's minimum requirement. But Node.js 20 reaches end-of-life on April 30, 2026. Node.js 22 LTS is supported until April 2027 — a full extra year of security updates. One extra step now saves you a forced upgrade later.
Add the NodeSource repository for Node.js 22:
curl -fsSL https://deb.nodesource.com/setup_22.x | bash -Install Node.js:
apt-get install -y nodejsVerify the installation:
node --versionnpm --versionYou should see Node.js 22.x and npm 10.x. The exact patch versions may differ.
A note about
curl | bash: This is the standard installation method from NodeSource and is widely used. If you prefer, you can download the script first withcurl -fsSL https://deb.nodesource.com/setup_22.x -o setup.sh, review it, then run it withbash setup.sh.
You may see locale warnings during apt operations (Cannot set LC_CTYPE to default locale). These are cosmetic — the minimal LXC template doesn't have locales configured, and it doesn't affect anything.
Clone the Uptime Kuma repository to /opt (the conventional location for manually installed software on Linux):
cd /opt && git clone https://github.com/louislam/uptime-kuma.gitPin to a specific version instead of running the latest — this protects you from unexpected breaking changes between releases:
cd /opt/uptime-kuma && git checkout 2.2.0Replace 2.2.0 with the latest version number from the Uptime Kuma releases page.
Run the setup, which installs Node.js dependencies and downloads the pre-built frontend:
npm run setupThis takes about 5-10 seconds. You'll see some deprecation warnings for upstream packages (rimraf, glob, npmlog) — these are from Uptime Kuma's dependencies and are harmless. npm may also suggest updating itself — skip that, the bundled version works fine.
Without a systemd service, you'd have to manually start Uptime Kuma every time the container restarts. Let's fix that.
Open a new service file with nano:
nano /etc/systemd/system/uptime-kuma.servicePaste in the following contents:
[Unit]
Description=Uptime Kuma - A self-hosted monitoring tool
After=network.target

[Service]
Type=simple
User=root
WorkingDirectory=/opt/uptime-kuma
ExecStart=/usr/bin/node server/server.js
Restart=on-failure
RestartSec=5

[Install]
WantedBy=multi-user.target
Save and exit nano with Ctrl+X, then Y, then Enter.
Quick breakdown of the important parts:
After=network.target — waits for networking before startingRestart=on-failure with RestartSec=5 — if Uptime Kuma crashes, systemd automatically restarts it after 5 secondsWantedBy=multi-user.target — starts on bootReload systemd to pick up the new service file:
systemctl daemon-reloadEnable the service so it starts on boot:
systemctl enable uptime-kumaStart the service:
systemctl start uptime-kumaVerify it's running:
systemctl status uptime-kumaYou should see active (running) and a log line showing Uptime Kuma listening on port 3001. You may see a punycode deprecation warning in the logs — this is a known Node.js cosmetic issue and has zero impact on functionality.
Open your browser and navigate to http://<your-container-ip>:3001 — in our case, http://10.1.20.50:3001. Use whatever IP address you assigned to your container in Step 2.
You'll be greeted with a database selection screen. Choose SQLite.
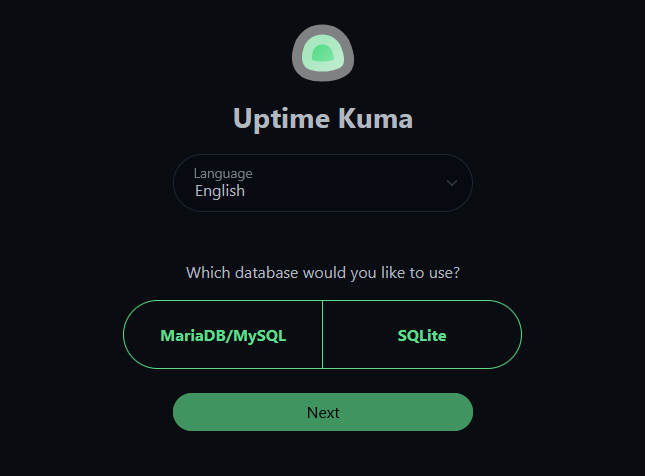
SQLite vs MariaDB? Uptime Kuma v2 added MariaDB support, but SQLite is the right choice for homelab. Zero config, single-file backups (
data/kuma.db), and it handles homelab scale effortlessly. MariaDB only makes sense at 150+ monitors.
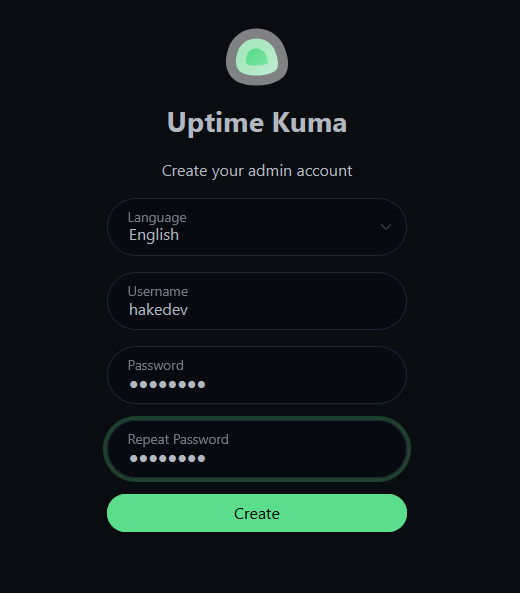
Next, create your admin account — pick a username and a strong password. This is the only account for the dashboard.
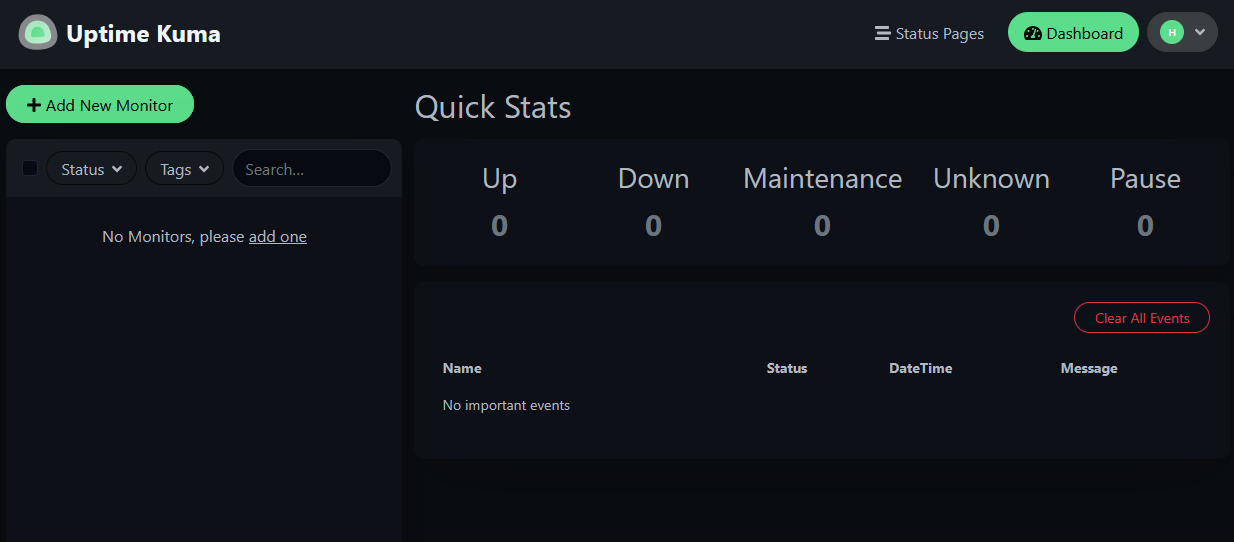
After logging in, you'll land on an empty dashboard with all Quick Stats at zero. Time to add some monitors.
Before we start clicking, here's what each monitor type does and when to use it:
| Monitor Type | What it checks | Best for |
|---|---|---|
| Ping | Is the machine alive? | Hosts, routers, switches, NAS |
| HTTP(s) | Is the web service responding? | Anything with a web UI or API |
| HTTP(s) - Keyword | Is it responding with the right content? | Critical services where "up but broken" is a risk |
| TCP Port | Is this port accepting connections? | Services without HTTP: databases, SSH, Samba |
| DNS | Is name resolution working? | Your DNS server (Pi-hole, Unbound) |
You don't need all types for every service. Here's a practical guide:
| Homelab service | Best monitor type | Why |
|---|---|---|
| Proxmox host | Ping | Just need to know it's alive |
| Pi-hole | DNS + HTTP | DNS to verify resolution, HTTP for admin panel |
| Reverse proxy | HTTP on each proxied service | If it goes down, all your domains break |
| Vaultwarden | Keyword ("Vaultwarden") | Catch proxy misconfigs serving the wrong page |
| Samba file server | TCP 445 | No web interface to check |
| Router / switch | Ping | Network gear — just alive/dead |
We'll set up one of each type so you can see them all in action.
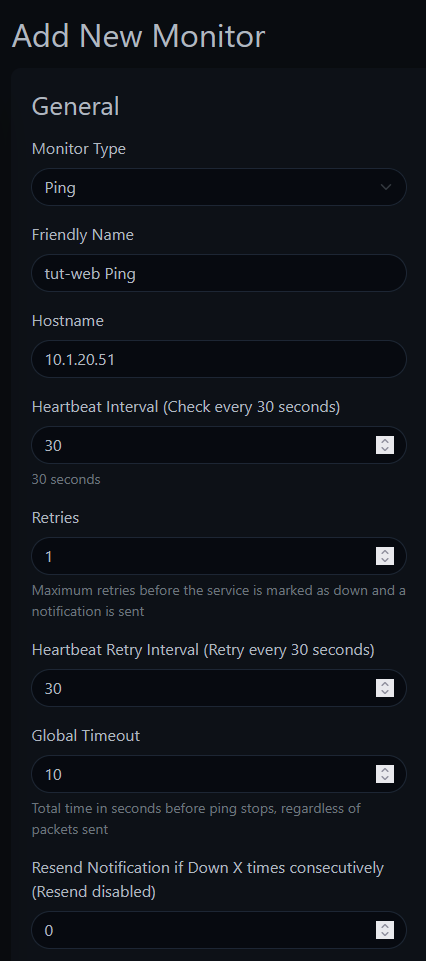
A note on retries: For all monitors in this tutorial, we set Retries to 1 instead of the default 0. This means Uptime Kuma retries once before marking a service as down, avoiding false alarms from a single dropped packet or momentary hiccup.
Click the green "+ Add New Monitor" button.
Configure:
tut-web Ping10.1.20.51 (your target IP — use the IP of any machine on your network you want to monitor)Click Save.
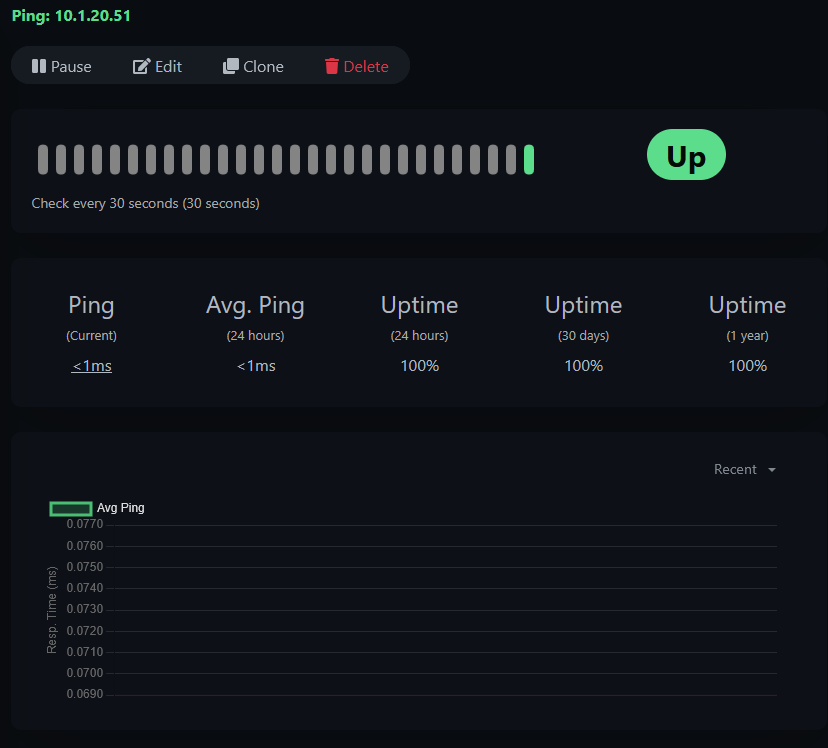
You should see a green "Added Successfully" toast and the monitor immediately start checking. Click into the monitor to see the detail view — response time graph, uptime percentages, and the heartbeat history.
Add another monitor:
tut-web HTTPhttp://10.1.20.51 (use any service on your network with a web interface)Watch the URL field — it pre-fills with
https://. If your service doesn't have TLS configured, make sure you change it tohttp://. Otherwise you'll get anECONNREFUSEDerror on port 443 and spend five minutes wondering why your perfectly running service shows as "down."
This is the most interesting monitor type. It checks not just that a service responds, but that it responds with the right content.
tut-web Keyword Checkhttp://10.1.20.51Welcome to nginx (use a word or phrase that appears on your service's page)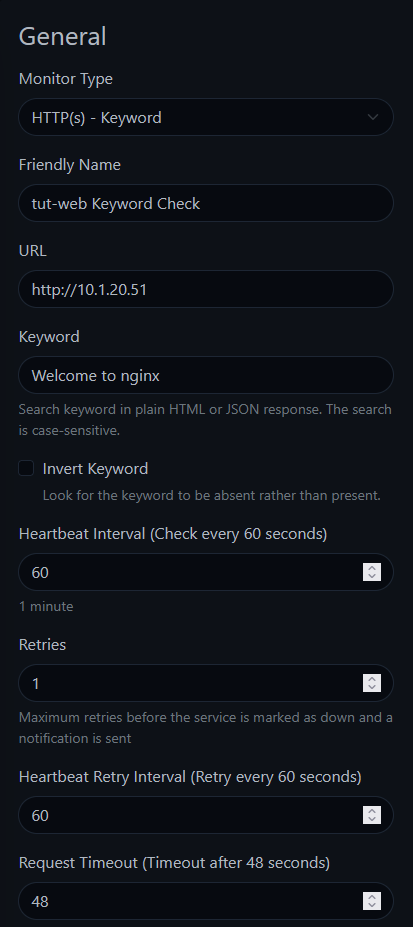
The keyword search is case-sensitive — Welcome to nginx is not the same as welcome to nginx. Match the exact text on the page.
Why is this useful? Imagine your reverse proxy goes down and your web server starts serving a default "Welcome to nginx" page instead of your actual application. An HTTP monitor would show green (it got a 200 response), but a keyword monitor looking for your app's actual content would catch it.
For services without a web interface — databases, SSH, Samba — TCP port monitoring verifies the port is accepting connections.
tut-web Port 8010.1.20.51If your DNS server goes down, everything looks broken — even services that are running fine. Monitoring DNS separately lets you immediately identify the root cause.
tut-dns DNS Lookupgoogle.com (the domain to resolve — not your DNS server)10.1.20.52 (your DNS server's IP — if you run Pi-hole or Unbound, use that IP. Otherwise, try your router's IP.)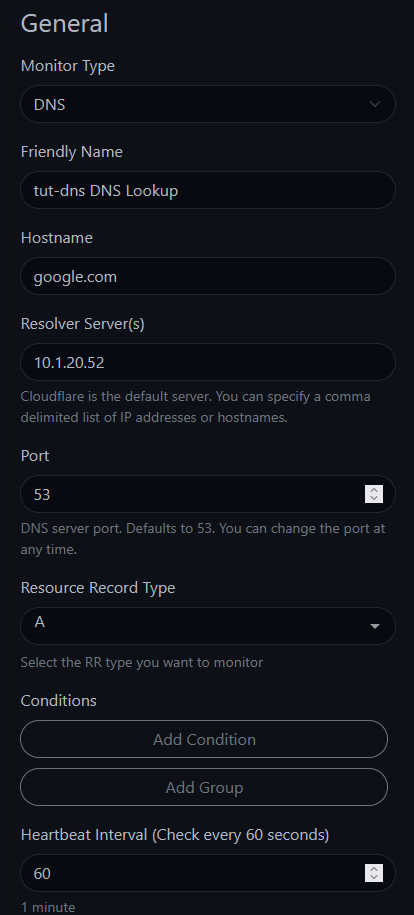
The field names trip people up. "Hostname" is the domain you want resolved (like
google.com). "Resolver Server" is the DNS server you're testing. It's unintuitive, but that's how it works.
You should see a success notification with the resolved IP addresses.
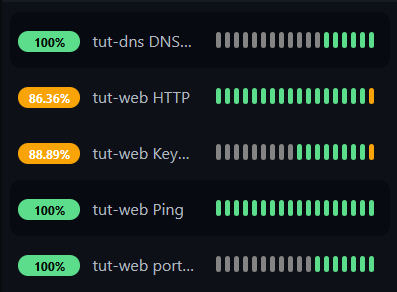
With all five monitors configured, your sidebar should look like this:
This is where it gets interesting. We're going to intentionally break things to see how each monitor responds.
First, let's stop nginx on the target machine while keeping the container running. From your Proxmox host (not from inside the container):
pct exec 151 -- systemctl stop nginxFollowing along with your own services? You can simulate the same thing by stopping any service on a machine you're monitoring —
systemctl stop <service-name>inside the container, orpct exec <ct-id> -- systemctl stop <service-name>from the Proxmox host.
Now watch the Uptime Kuma dashboard. Within 30-60 seconds:
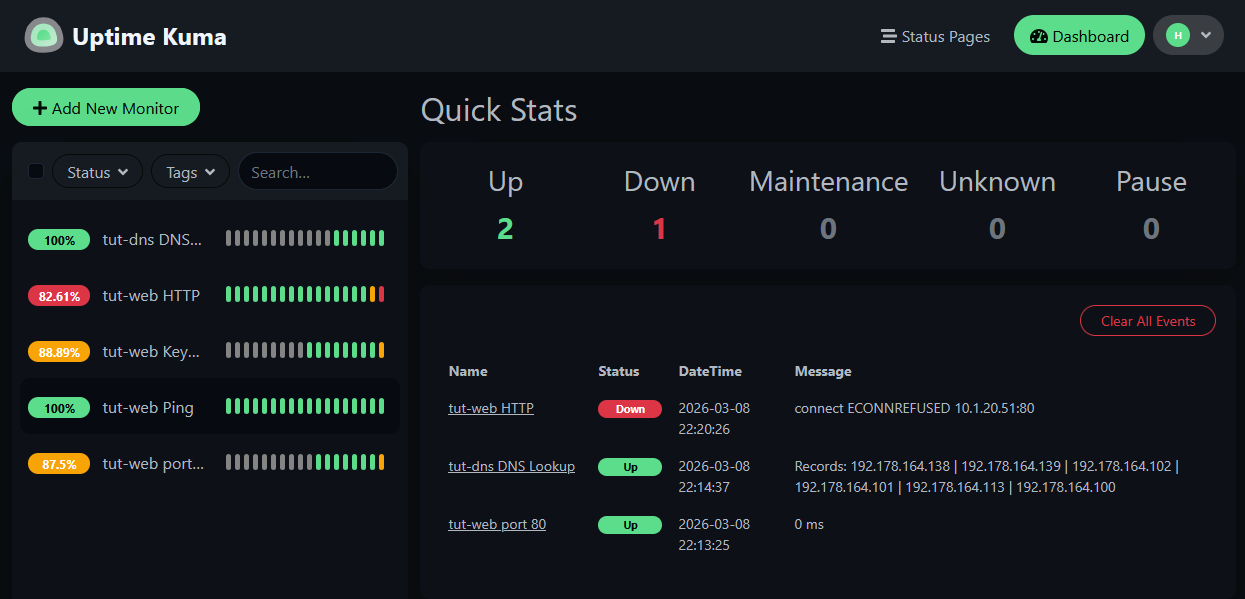
The HTTP, Keyword, and TCP Port monitors go red — but Ping stays green. The machine is alive, but the service is down. If you only had a Ping monitor, you'd never know nginx crashed.
This is exactly the scenario that happens in real life — a service crashes, the container keeps running, and nobody notices until someone tries to use the service.
Now let's take down the entire container:
pct stop 151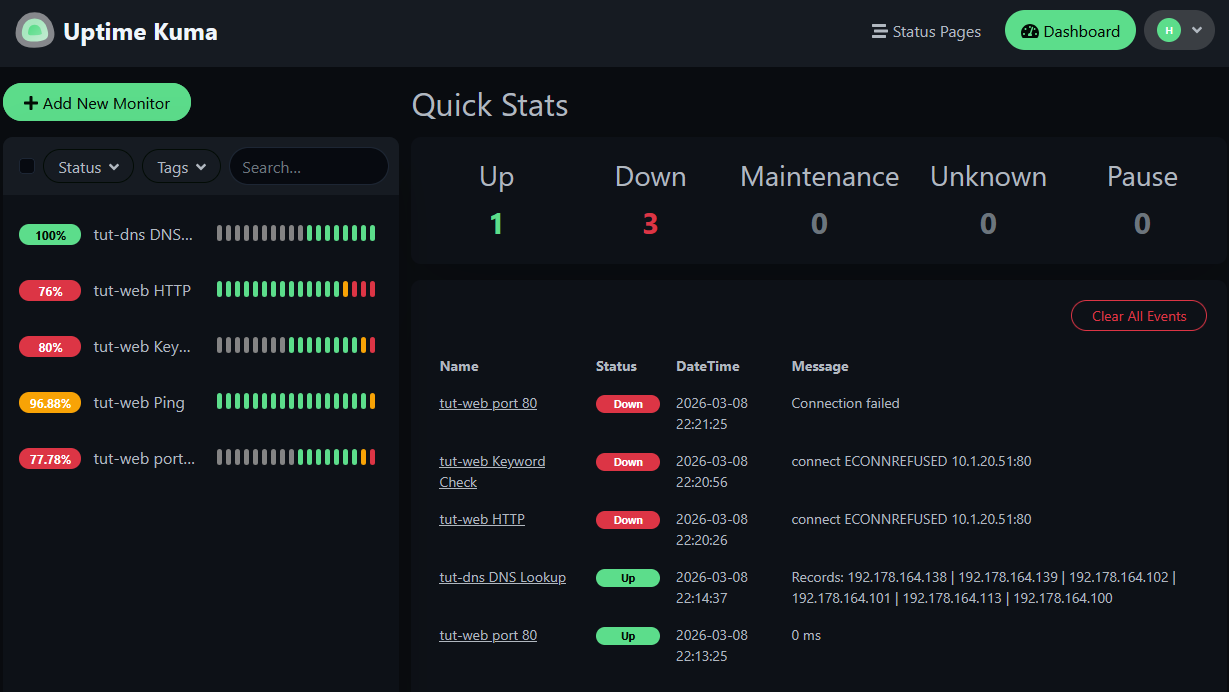
Now Ping goes red too. Every monitor targeting that container is down. Only the DNS monitor stays green — it's monitoring a completely different machine.
The contrast is the lesson: when the service was down but the host was alive, Ping couldn't tell you anything was wrong. Different failures need different monitors.
Start the container back up:
pct start 151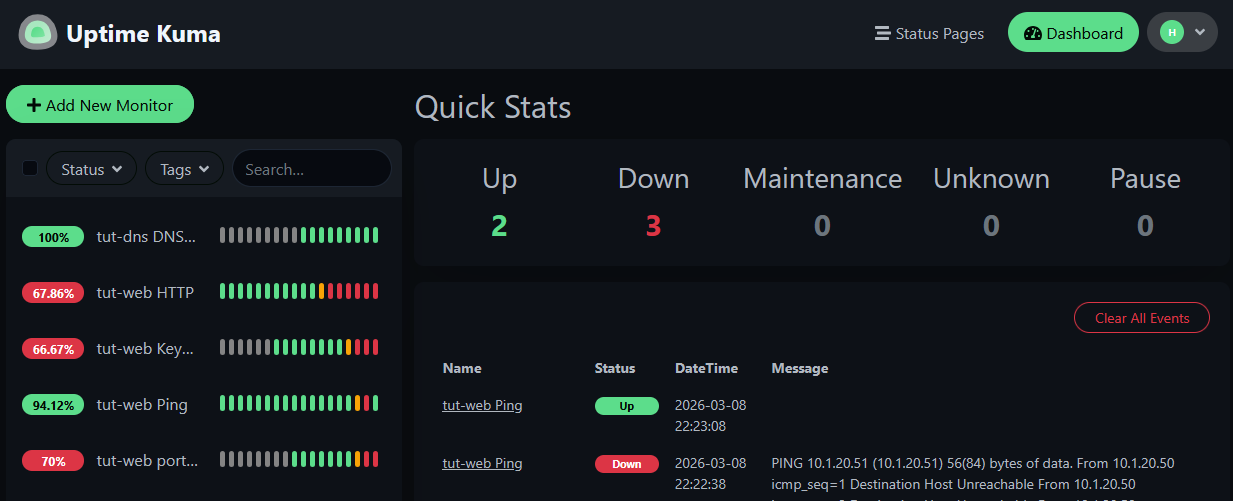
Watch the monitors recover one by one. Ping comes back first — the container is reachable before nginx finishes starting. Then HTTP, Keyword, and TCP Port follow as the service comes up.
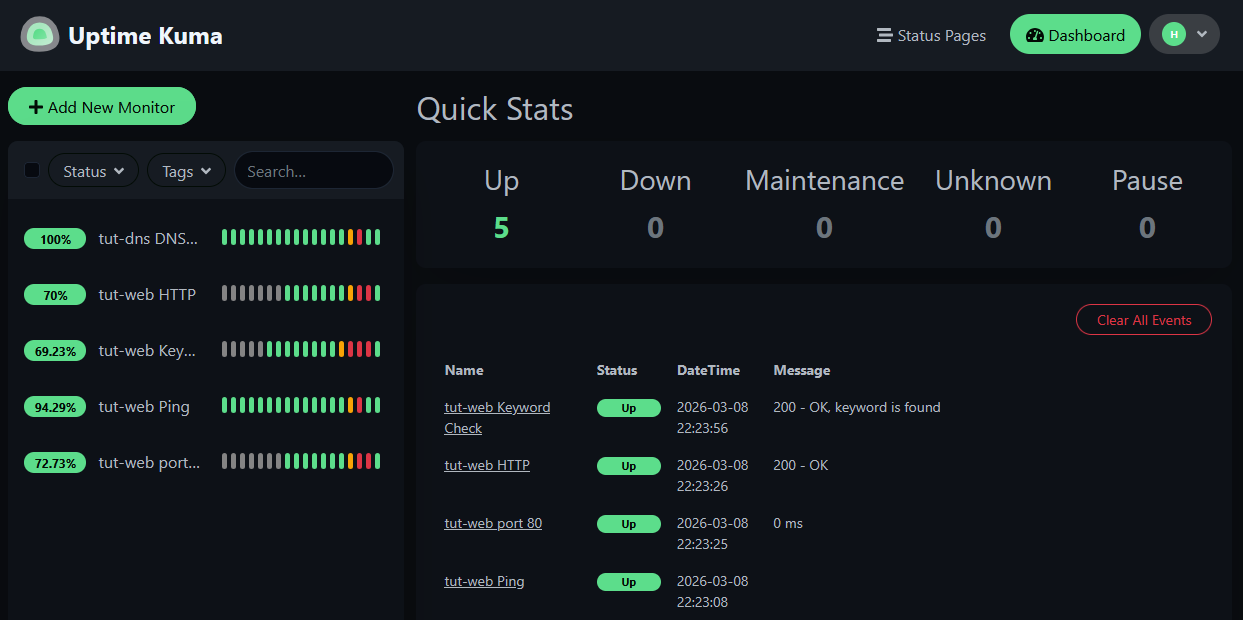
All five monitors back to green. The downtime blips are visible in the heartbeat history bars and the uptime percentages reflect the outage.
You now have:
Next up: Part 2: Notifications & Alerts — set up Pushover and Discord so you actually find out when something goes down, instead of discovering it when you try to use the service.
Then in Part 3: Advanced Features, we'll cover status pages, maintenance windows, monitor groups, certificate expiry monitoring, and "who watches the watchman?"
Some links are affiliate links. I may earn a small commission at no extra cost to you.
![Rustdesk Server [Helper Script]](https://yluprwigbnqpbhrfqpfn.supabase.co/storage/v1/object/public/content/proxmox-rustdesk-server/41laeWe1Q10.jpg)