.png)
OpenClaw on AMD Strix Halo: Set Up a Self-Hosted AI Agent with 128GB Unified Memory
March 26, 2026Tutorial
⚠This site is under active development. Some features may not work as expected, and new content is being added regularly.
.png)
In Part 1, we set up OpenClaw on Strix Halo and manually asked the agent to check services. That worked, but it required you to be at the keyboard. The real value of an AI agent is when it works without you — detecting problems, investigating them, and telling you what it found.
That's what we're building here. Uptime Kuma watches your services and detects failures within seconds. When something goes down, it fires a webhook to OpenClaw. The agent SSHes into your Proxmox host, runs pre-written diagnostic scripts, reads the structured output, and posts an investigation report. Uptime Kuma tells you something is down. The agent tells you why.
The key design decision is separation of concerns. Uptime Kuma is purpose-built for fast detection — sub-minute health checks. OpenClaw is purpose-built for reasoning and tool use. And the diagnostic scripts are deterministic — they always collect the same data the same way. The LLM never touches your infrastructure directly. It reads what the scripts collected and reasons about it.
NOTE
This is Part 2 of a 6-part series. Part 1 set up the agent. This part connects it to Uptime Kuma. Parts 3-6 cover Matrix integration, a model shootout, backup/restore, and production hardening.
Service goes down
       |
       v
Uptime Kuma (checks every 30-60s)
       |  detects failure
       v
POST /hooks/agent (webhook to OpenClaw)
       |  "tut-monitor nginx is DOWN"
       v
OpenClaw (isolated agent turn)
       |  SSHes into Proxmox
       |  runs diagnostics-index
       |  picks the right diagnostic script
       |  runs diagnostics-tut-monitor
       v
Diagnostic Script Output
  (container status, service status, logs,
   OOM check, memory, disk — structured)
       |
       v
LLM Analysis (GLM-4.7-flash)
       |  "nginx was OOM-killed. Container has
       |   128MB RAM, process exceeded limit."
       v
WebChat report
  (visible in OpenClaw Control UI)
Two clean separations here. Detection vs investigation — Uptime Kuma detects, OpenClaw investigates. And data collection vs analysis — scripts collect deterministic data, the LLM reasons about it. The scripts are testable and auditable. The LLM adds the intelligence layer on top.
The agent needs SSH access to your Proxmox host to run diagnostic scripts. We create a dedicated key — not your personal key — so it can be restricted and revoked independently.
NOTE
Ed25519 vs RSA: Ed25519 is the modern default — smaller keys, faster operations, no configuration pitfalls. RSA is only needed for legacy systems running OpenSSH < 6.5 (pre-2014).
NOTE
No passphrase: For automated agent use, passphraseless keys are standard. The security trade-off is acceptable when combined with command= restriction (limiting what the key can do), from= restriction (limiting which IP can use it), and strict file permissions. Adding a passphrase would require ssh-agent for unattended use — complexity without meaningful security gain on a private LAN.
Run this on your OpenClaw machine:
ssh-keygen -t ed25519 -C "openclaw-agent -> proxmox diagnostics" -f ~/.ssh/id_ed25519_proxmox_monitor -N ""This creates a key pair at ~/.ssh/id_ed25519_proxmox_monitor (private) and ~/.ssh/id_ed25519_proxmox_monitor.pub (public). The -N "" means no passphrase.
This is the most important security layer in the entire tutorial. We create a shell script on the Proxmox host that acts as a gateway. The SSH key will be locked to this script via command= in authorized_keys, and it only allows running scripts that match the diagnostics-* pattern. Everything else is denied.
NOTE
Why a dispatcher instead of a command allowlist? The alternative would be regex-validating individual commands — systemctl, journalctl, pct exec, etc. That's fragile, hard to audit, and lets the agent run arbitrary monitoring commands. The diagnostic script pattern is cleaner: pre-written scripts collect deterministic data, the dispatcher only routes to those scripts, and the LLM only sees structured output. Adding a new service means writing one script — not updating regex patterns.
SSH into your Proxmox host and create the dispatcher:
nano /usr/local/bin/diagnostics-dispatch.shPaste the following, then save with Ctrl+X, Y, Enter:
#!/bin/bash
# OpenClaw diagnostics dispatcher
# Locked via authorized_keys command= directive
# Only permits diagnostics-* scripts and the index

CMD="$SSH_ORIGINAL_COMMAND"

case "$CMD" in
    diagnostics-index)
        echo "=== Available Diagnostic Scripts ==="
        echo ""
        for script in /usr/local/bin/diagnostics-*; do
            [ -x "$script" ] || continue
            name=$(basename "$script")
            [ "$name" = "diagnostics-dispatch.sh" ] && continue
            desc=$(head -5 "$script" | grep "^# DESC:" | sed "s/^# DESC: //")
            printf "  %-30s %s\n" "$name" "$desc"
        done
        echo ""
        echo "Run any script by name: ssh proxmox diagnostics-<name>"
        ;;

    diagnostics-*)
        SCRIPT_NAME="${CMD%% *}"
        if [ "$CMD" != "$SCRIPT_NAME" ]; then
            echo "Arguments not permitted: $CMD" >&2
            exit 1
        fi
        SCRIPT_PATH="/usr/local/bin/$SCRIPT_NAME"
        if [ -x "$SCRIPT_PATH" ]; then
            exec "$SCRIPT_PATH"
        else
            echo "Unknown diagnostic script: $SCRIPT_NAME" >&2
            echo "Run diagnostics-index for available scripts." >&2
            exit 1
        fi
        ;;

    *)
        echo "Command not permitted: $CMD" >&2
        echo "Only diagnostics-* scripts are allowed." >&2
        exit 1
        ;;
esac
Make it executable:
chmod 755 /usr/local/bin/diagnostics-dispatch.shThe dispatcher is self-documenting — diagnostics-index auto-discovers scripts by scanning /usr/local/bin/diagnostics-*. Adding a new service later is: write one script, done. No dispatcher changes needed.
Still on your Proxmox host — this is a general host health check. When something goes wrong, you need to know if it's the service or the host itself.
nano /usr/local/bin/diagnostics-hostPaste the following, then save with Ctrl+X, Y, Enter:
#!/bin/bash
# DESC: Proxmox host health — CPU, memory, disk, ZFS, containers, temps

echo "=== DIAGNOSTIC: Proxmox Host ==="
echo "Timestamp: $(date -u "+%Y-%m-%d %H:%M:%S UTC")"
echo ""

echo "--- Uptime & Load ---"
uptime
echo ""

echo "--- Memory ---"
free -h
echo ""

echo "--- Disk Usage ---"
df -h / /var /tmp 2>/dev/null
echo ""

echo "--- ZFS Pool Status ---"
zpool list 2>/dev/null || echo "No ZFS pools found"
zpool status -x 2>/dev/null
echo ""

echo "--- Container Summary ---"
echo "Running:"
pct list 2>/dev/null | grep running | wc -l
echo "Stopped:"
pct list 2>/dev/null | grep stopped | wc -l
echo ""
echo "All containers:"
pct list 2>/dev/null
echo ""

echo "--- VM Summary ---"
qm list 2>/dev/null | tail -n +2 | head -20
echo ""

echo "--- Temperatures ---"
sensors 2>/dev/null | grep -E "^(coretemp|k10temp|Tctl|Tdie|Package)" -A2 || echo "lm-sensors not available"
echo ""

echo "--- Recent Kernel Messages (errors/warnings) ---"
dmesg --level=err,warn -T 2>/dev/null | tail -10
echo ""

echo "=== END DIAGNOSTIC ==="chmod 755 /usr/local/bin/diagnostics-hostEvery diagnostic script follows the same format: header with timestamp, labeled sections, footer. Consistent format means the LLM can parse any script's output the same way.
This step bounces between two machines. Follow carefully.
Part A — On your OpenClaw machine, copy the public key:
cat ~/.ssh/id_ed25519_proxmox_monitor.pubSelect and copy the entire output.
Part B — On your Proxmox host, open the authorized_keys file:
nano /root/.ssh/authorized_keysAdd a new line at the bottom with this format — paste your public key where it says YOUR_PUBLIC_KEY:
restrict,command="/usr/local/bin/diagnostics-dispatch.sh",from="10.1.10.12" YOUR_PUBLIC_KEYSave with Ctrl+X, Y, Enter.
WARNING
Replace 10.1.10.12 with your OpenClaw machine's actual IP address. The from= restriction means only that specific IP can use this key.
Three layers of restriction on a single line:
restrict — disables all forwarding, PTY allocation, tunneling. Nothing except the forced command works.command= — every SSH session using this key is forced through the dispatcher. The agent can't bypass it.from= — only accepts connections from your OpenClaw machine's IP. Even if the key is stolen, it's useless from any other IP.Back on your OpenClaw machine. Set up an SSH config alias so the agent can connect with ssh proxmox:
nano ~/.ssh/configAdd the following at the bottom (replace the IP with your Proxmox host's IP), then save with Ctrl+X, Y, Enter:
Host proxmox
    HostName 10.1.10.10
    User root
    IdentityFile ~/.ssh/id_ed25519_proxmox_monitor
    IdentitiesOnly yes
    BatchMode yes
    StrictHostKeyChecking accept-new
    ConnectTimeout 5
    ServerAliveInterval 30
    ServerAliveCountMax 3
Set the correct permissions — SSH refuses to use config files that are readable by others:
chmod 600 ~/.ssh/configWARNING
BatchMode yes is critical. Without it, if the SSH client encounters a password prompt (wrong key, misconfigured host), it waits for keyboard input — and the agent hangs forever. BatchMode makes SSH fail immediately with an error instead of waiting. Always use this for automated SSH.
WARNING
Read this before proceeding. This step disables password-based SSH on your Proxmox host. After applying this, only key-based authentication works for SSH. If you currently SSH into Proxmox with a password (not a key), you will be locked out of SSH. Before continuing:
ssh-copy-id root@your-proxmox-ip from your workstation first.On your Proxmox host, we create a drop-in file instead of editing the main sshd_config — this way Proxmox upgrades won't overwrite our changes:
nano /etc/ssh/sshd_config.d/hardening.confPaste the following, then save with Ctrl+X, Y, Enter:
# Key-only authentication
PasswordAuthentication no
KbdInteractiveAuthentication no
PubkeyAuthentication yes
PermitRootLogin prohibit-password
AuthenticationMethods publickey

# Brute-force mitigation
MaxAuthTries 3
LoginGraceTime 20
MaxStartups 3:50:10
MaxSessions 5

# Disable unused features
HostbasedAuthentication no
PermitEmptyPasswords no
AllowTcpForwarding no
X11Forwarding no
AllowAgentForwarding no
PermitTunnel no

# Logging
LogLevel VERBOSE
NOTE
Why prohibit-password instead of no for PermitRootLogin? Proxmox is designed around root access. PermitRootLogin no breaks the web UI, pvesh, and standard admin workflows. prohibit-password keeps key-based root access while blocking password brute-force.
Before restarting sshd, test the configuration for syntax errors. sshd -t reads the config files and checks for typos or invalid options WITHOUT restarting the service. If there's an error, it tells you exactly what's wrong. If the config is clean, it exits silently with no output:
sshd -tIf you see no output, the config is valid. Now restart sshd to apply the changes:
systemctl restart sshdIf sshd -t printed an error, fix the typo in hardening.conf before restarting. Never restart sshd with a broken config — it may fail to start and you lose SSH access entirely.
Back on your OpenClaw machine. Before giving the agent access, verify the security model works. Test each command individually.
This should return a list of available diagnostic scripts:
ssh proxmox diagnostics-indexYou should see diagnostics-host listed. (The diagnostics-tut-monitor script doesn't exist yet — we create it in Step 9.)
This should return full host health data:
ssh proxmox diagnostics-hostYou should see the timestamped diagnostic output with uptime, memory, disk, ZFS, containers, and kernel messages.
Now test denied commands.
WARNING
The denied command tests below are safe ONLY if you set up the authorized_keys restriction correctly in Step 4. The command= directive forces all SSH sessions through the dispatcher, which blocks everything except diagnostics-* scripts. If you skipped Step 4 or added the key without the restrict,command=,from= prefix, these commands would execute as root on your Proxmox host. rm -rf / would delete your entire filesystem. Before running these tests, verify your authorized_keys entry on the Proxmox host: cat /root/.ssh/authorized_keys — confirm the line starts with restrict,command=.
This should print "Command not permitted" and exit:
ssh proxmox whoamiThis should also be denied — rm -rf / deletes the entire filesystem, but the dispatcher blocks it before it reaches the shell:
ssh proxmox "rm -rf /"This is an injection attempt — it should print "Arguments not permitted" because the dispatcher blocks commands with spaces:
ssh proxmox "diagnostics-host; rm -rf /"All three denied commands should exit with an error message. We're logged in as root, and it still says no. That's the point — the key can only run diagnostic scripts.
NOTE
We're setting up an isolated test container so we can safely simulate failures without affecting real services. This container lives on VLAN 20 (our tutorial/lab network), completely isolated from production. You don't have to create this if you'd rather point the webhook at a real service — but the failure scenarios later (stopping nginx, triggering OOM) are things you definitely don't want to do on a production container.
On your Proxmox host:
pct create 150 local:vztmpl/debian-13-standard_13.1-2_amd64.tar.zst \
  --hostname tut-monitor \
  --cores 1 \
  --memory 128 \
  --swap 0 \
  --rootfs local-lvm:2 \
  --net0 name=eth0,bridge=vmbr0,tag=20,ip=10.1.20.150/24,gw=10.1.20.1 \
  --nameserver 10.1.99.100 \
  --features nesting=1 \
  --unprivileged 1 \
  --start 1
NOTE
Adjust the VLAN tag, IP, gateway, and DNS server for your network. The 128MB RAM with no swap is intentionally low — enough for nginx but easy to OOM. That's the point for our test scenarios.
Install nginx as the test service:
pct exec 150 -- bash -c "apt-get update -qq && apt-get install -y -qq --no-install-recommends nginx curl procps > /dev/null 2>&1 && systemctl enable nginx && systemctl start nginx"TIP
You may see Perl locale warnings like "Falling back to the standard locale." These are cosmetic — the install completed successfully. You can ignore them.
Verify nginx is running:
pct exec 150 -- curl -s -o /dev/null -w "%{http_code}" http://localhostYou should see 200.
Still on your Proxmox host. Each service gets its own diagnostic script that knows exactly what to check.
nano /usr/local/bin/diagnostics-tut-monitorPaste the following, then save with Ctrl+X, Y, Enter:
#!/bin/bash
# DESC: CT 150 tut-monitor — nginx test service on VLAN 20

CT=150

echo "=== DIAGNOSTIC: tut-monitor (CT $CT) ==="
echo "Timestamp: $(date -u "+%Y-%m-%d %H:%M:%S UTC")"
echo ""

echo "--- Container Status ---"
pct status $CT 2>&1
echo ""

STATUS=$(pct status $CT 2>/dev/null | awk '{print $2}')
if [ "$STATUS" != "running" ]; then
    echo "Container is NOT running. Cannot check internal services."
    echo ""
    echo "--- Host OOM Events (CT $CT) ---"
    dmesg -T 2>/dev/null | grep -i "lxc/$CT" | grep -iE "oom|killed|out of memory" | tail -10 || echo "No OOM events found on host for CT $CT"
    echo ""
    echo "--- Host Health ---"
    echo "Load: $(cat /proc/loadavg)"
    free -h | head -2
    echo ""
    echo "=== END DIAGNOSTIC ==="
    exit 0
fi

echo "--- Service: nginx ---"
pct exec $CT -- systemctl status nginx --no-pager 2>&1
echo ""

echo "--- Recent nginx Logs ---"
pct exec $CT -- journalctl -u nginx --no-pager -n 20 2>&1
echo ""

echo "--- System Logs (OOM / Kill) ---"
pct exec $CT -- journalctl --no-pager -n 50 2>&1 | grep -iE "oom|killed|out of memory|invoked oom|memory cgroup" || echo "No OOM events found in container logs"
echo ""

echo "--- Host OOM Events (CT $CT) ---"
dmesg -T 2>/dev/null | grep -i "lxc/$CT" | grep -iE "oom|killed|out of memory" | tail -10 || echo "No OOM events found on host for CT $CT"
echo ""

echo "--- Memory ---"
pct exec $CT -- free -h 2>&1
echo ""

echo "--- Disk ---"
pct exec $CT -- df -h / 2>&1
echo ""

echo "--- Top Processes by Memory ---"
pct exec $CT -- ps aux --sort=-%mem 2>&1 | head -6
echo ""

echo "=== END DIAGNOSTIC ==="chmod 755 /usr/local/bin/diagnostics-tut-monitorWARNING
The "Host OOM Events" sections are critical. OOM kills in LXC containers are logged in the HOST kernel's dmesg, NOT inside the container's journalctl. The kernel terminates processes from outside the container's namespace, so the container journal has no record. Without checking host dmesg, the agent would see "container stopped" with zero explanation.
Back on your OpenClaw machine. Run both scripts through the restricted SSH connection to verify everything works together.
Check the index — both scripts should now appear:
ssh proxmox diagnostics-indexYou should see diagnostics-host and diagnostics-tut-monitor listed:
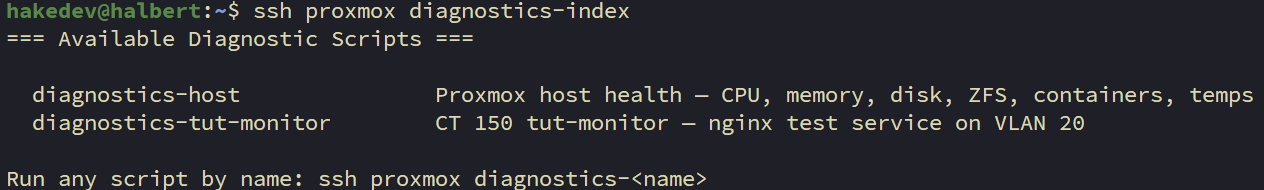
Run host diagnostics:
ssh proxmox diagnostics-hostYou should see the full host health output — uptime, memory, disk, ZFS, containers.
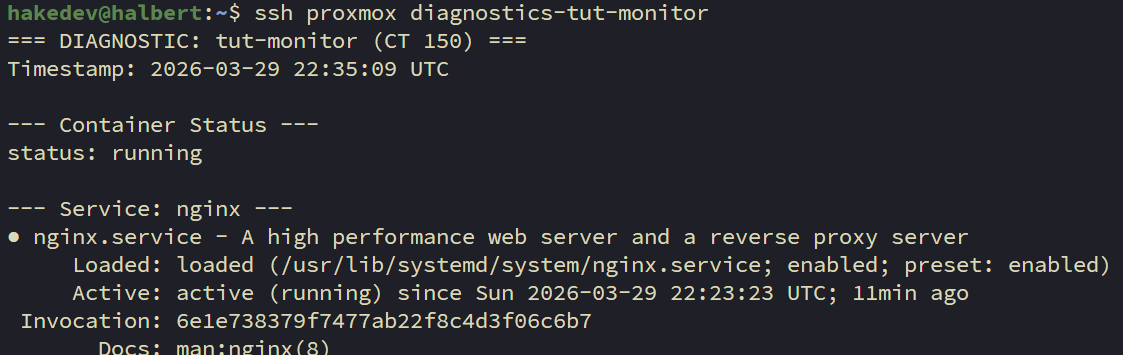
Run the tut-monitor diagnostics:
ssh proxmox diagnostics-tut-monitorYou should see nginx active, no OOM events, and low memory usage. This is your "healthy baseline" — compare it to the failure scenario output later.
On your OpenClaw machine. The agent needs permission to run SSH. OpenClaw uses an allowlist — only pre-approved binaries can execute.
Set the exec tool to allowlist mode. Each command configures one setting:
This tells OpenClaw to run exec commands on the gateway (not a remote sandbox):
openclaw config set tools.exec.host gatewayThis sets the security mode to allowlist — only explicitly approved binaries can run:
openclaw config set tools.exec.security allowlistThis disables the interactive approval prompt so webhook-triggered sessions can run without human confirmation:
openclaw config set tools.exec.ask offThese are safe read-only binaries the agent can pipe data through (grep, head, etc.):
openclaw config set tools.exec.safeBins '["grep","head","tail","wc","sort","cut"]'These are the directories where safeBins are trusted:
openclaw config set tools.exec.safeBinTrustedDirs '["/bin","/usr/bin"]'Now approve SSH for the main agent. This is a separate allowlist from the config above — it controls which full binaries (not just pipe filters) the agent can execute:
openclaw approvals allowlist add --agent main "/usr/bin/ssh"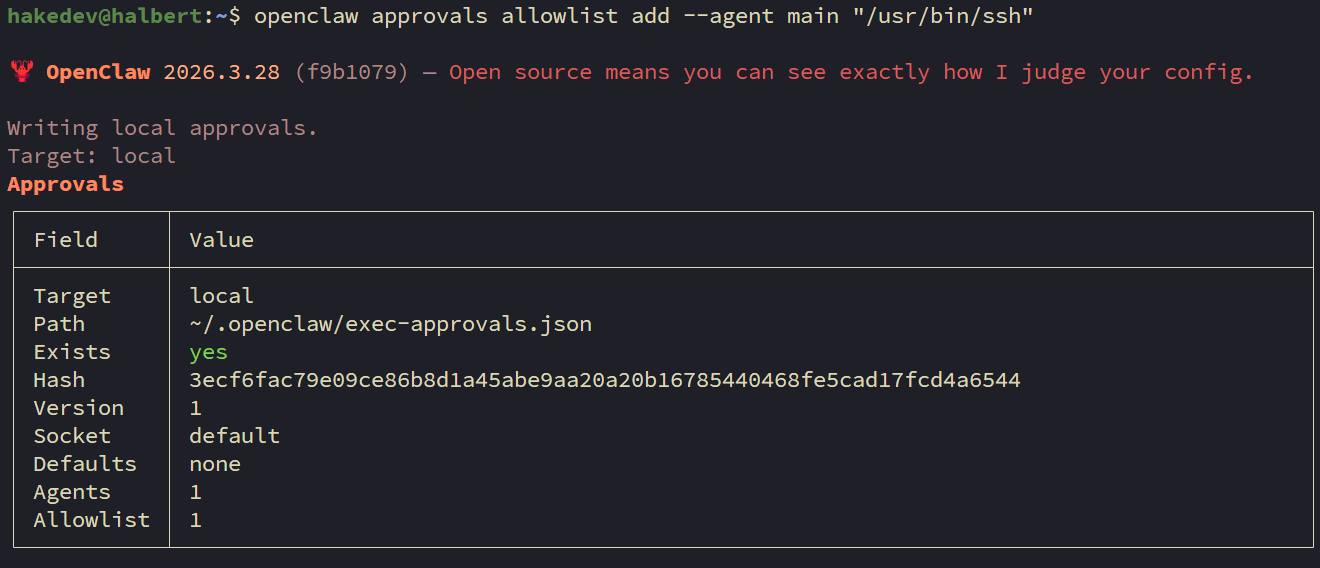
WARNING
OpenClaw has TWO layers of exec allowlisting. safeBins covers stdin-only pipe filters (grep, head, etc.). exec-approvals (managed via openclaw approvals allowlist add) covers full binaries that can make network connections. SSH needs to be in the second layer. It must be added to the main agent specifically — the wildcard * agent does not reliably propagate to webhook-triggered sessions. If you skip this step, webhook triggers will silently fail with "exec denied: allowlist miss" in the logs.
Still on your OpenClaw machine. The hooks API is how Uptime Kuma triggers OpenClaw — it's a built-in webhook endpoint at POST /hooks/agent.
First, generate a secure random token:
openssl rand -hex 24Copy the output — that's your webhook token. Now configure the hooks using the CLI. Each command sets one field:
Enable the hooks system:
openclaw config set hooks.enabled trueSet the authentication token (replace with your generated token):
openclaw config set hooks.token "YOUR_TOKEN_FROM_ABOVE"Set the webhook path:
openclaw config set hooks.path "/hooks"Restrict which agents can be triggered by webhooks:
openclaw config set hooks.allowedAgentIds '["main"]'Set the default session key — this determines which session context webhook responses appear in:
openclaw config set hooks.defaultSessionKey "hook:ingress"Restart OpenClaw to apply all changes:
systemctl --user restart openclaw-gatewayVerify it's running:
systemctl --user status openclaw-gateway --no-pager | head -5You should see active (running).
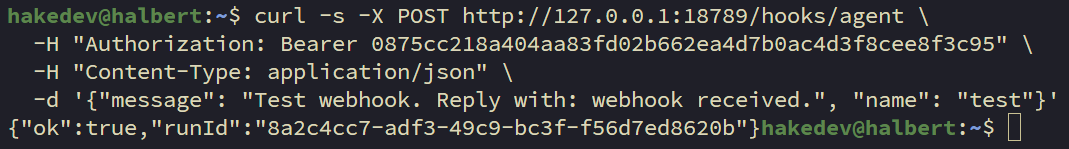
Test the hooks API with curl to make sure it's responding. Replace YOUR_TOKEN with your actual token:
curl -s -X POST http://127.0.0.1:18789/hooks/agent \
  -H "Authorization: Bearer YOUR_TOKEN" \
  -H "Content-Type: application/json" \
  -d '{"message": "Test webhook. Reply with: webhook received.", "name": "test"}'
You should get a JSON response with "ok": true and a runId:
Check WebChat — switch to the hook:ingress session in the dropdown. The agent should have responded to the test message:

NOTE
The hook:ingress session is separate from your default chat session. All webhook-triggered responses land here. The agent maintains context across webhook triggers in this session — it can reference previous investigations.
In Uptime Kuma's web UI, add a new monitor:
http://10.1.20.150 (your test container's IP)Save and verify it shows as UP.
NOTE
Uptime Kuma needs network access to your test container's VLAN. If they're on different VLANs, ensure your firewall allows traffic on port 80 between them.
This is where Uptime Kuma meets OpenClaw. In Uptime Kuma, go to Settings > Notifications > Setup Notification:
http://10.1.10.12:18789/hooks/agent (your OpenClaw machine's IP){ "Authorization": "Bearer YOUR_HOOKS_TOKEN" }{
"message": "ALERT from Uptime Kuma: {{ monitorJSON.name }} is {{ status }}. URL: {{ hostnameOrURL }}. Error: {{ msg }}. If the status is Down, investigate this service outage: use the command ssh proxmox diagnostics-index to see available diagnostic scripts, then run the appropriate one with ssh proxmox diagnostics-<name>. Analyze the diagnostic output and report your findings — what is the root cause, what is the current state, and what should be done to fix it. If the status is Up, briefly acknowledge the recovery and do not run diagnostics.",
"name": "UptimeKuma"
}Click "Test" to verify connectivity, then apply this notification to the "tut-monitor nginx" monitor.
WARNING
The webhook message must use explicit command syntax. Notice it says "use the command ssh proxmox diagnostics-index" — not "SSH to proxmox and run diagnostics-index." During testing, we found that vague instructions caused the agent to try SSHing directly to the container IP instead of using the ssh proxmox alias. The agent needs the exact command, not a description of the action.
NOTE
The webhook includes instructions for both Down and Up events. When a service recovers, Uptime Kuma sends a webhook with status "Up" — the message tells the agent to just acknowledge it without running diagnostics. This keeps the recovery notifications clean instead of triggering unnecessary investigations.
Time to break things. On your Proxmox host, stop nginx to simulate a service crash:
pct exec 150 -- systemctl stop nginxWithin 30-60 seconds:
diagnostics-index, picks diagnostics-tut-monitor, runs it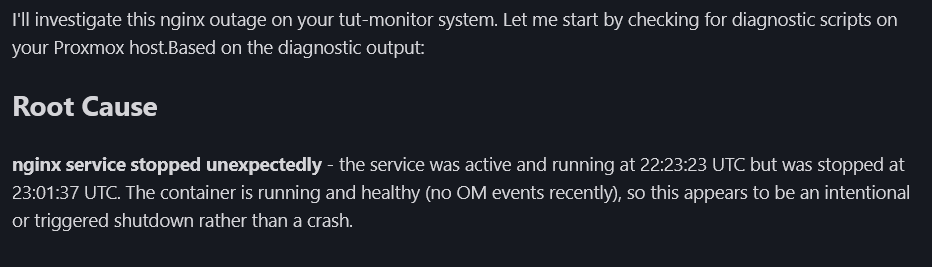
The agent doesn't just say "it's down." It reports: nginx was stopped, container is healthy, no memory pressure, no errors in logs. That's the difference between detection and investigation.
After reviewing the report, restore nginx:
pct exec 150 -- systemctl start nginxWait for Uptime Kuma to show green again. When the service recovers, the agent acknowledges it without running a full investigation:

This is the harder scenario. OOM kills are one of the most confusing failure modes — the service just disappears with no obvious error in the container's own logs.
WARNING
We're going to intentionally cause memory pressure on the test container so the OOM killer fires and leaves real evidence in the host logs. This is safe because CT 150 is our isolated test container — never do this on a production container. The python command below tries to allocate 256MB of memory in a container with only 128MB. The kernel's OOM killer steps in, kills the process, and logs it in the host's dmesg. That log entry is what the diagnostic script will find when the agent investigates.
First, create the OOM evidence. On your Proxmox host, run this command which forces the OOM killer to act:
pct exec 150 -- python3 -c "a = bytearray(256*1024*1024)" 2>&1 || trueYou should see something like Killed. The OOM killer terminated the python process because it tried to use more memory than the container allows. This event is now logged in the host's dmesg.
Now stop the container to simulate a catastrophic OOM where the whole container goes down:
pct stop 150Within 30-60 seconds, Uptime Kuma detects the outage and fires the webhook. The agent should find:
dmesg (from the python allocation we just triggered)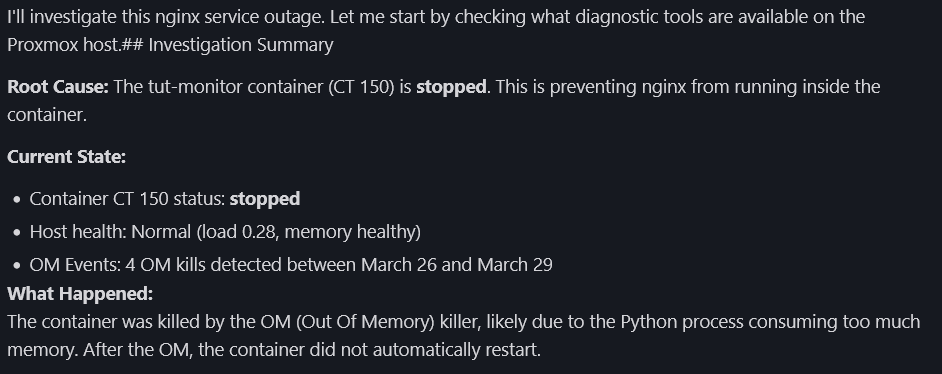
This is where the "Host OOM Events" section in the diagnostic script proves its worth. Without it, the agent would only see "container stopped" — no explanation, no root cause. With it, the agent finds the OOM evidence in dmesg and connects the dots.
After reviewing, restore the container:
pct start 150Wait a few seconds for the container to boot, then start nginx:
pct exec 150 -- systemctl start nginx"Permission denied (publickey)" — The key isn't in authorized_keys on the Proxmox host, or the from= restriction doesn't match your OpenClaw machine's IP. Debug with ssh -v proxmox diagnostics-index — the verbose output shows which keys were tried and why they were rejected.
"Command not permitted" — The dispatcher is working correctly — the command you tried isn't a diagnostics-* script. If you need a new diagnostic check, write a new script in /usr/local/bin/ starting with diagnostics-.
"Arguments not permitted" — The dispatcher blocks commands with spaces (like diagnostics-host some-arg) as injection prevention. Diagnostic scripts take no arguments — they're self-contained.
SSH hangs instead of failing — Missing BatchMode yes in ~/.ssh/config on the OpenClaw machine. Without it, SSH waits for keyboard input on a password prompt instead of failing immediately.
"exec denied: allowlist miss" — The SSH binary isn't approved in OpenClaw's exec approvals. Run openclaw approvals allowlist add --agent main "/usr/bin/ssh" on the OpenClaw machine. This is separate from the safeBins in openclaw.json.
Webhook fires but agent does nothing — Check that hooks are enabled: openclaw config get hooks.enabled. Verify you restarted the gateway after configuring. Also verify the SSH approval is for agent main specifically.
Agent SSHes to the wrong host — The webhook body uses vague language. Make sure it says "use the command ssh proxmox diagnostics-index" with the exact alias.
Monitor DOWN but webhook doesn't fire — The notification must be explicitly assigned to the monitor in Uptime Kuma. Creating a notification type isn't enough — you have to attach it to each monitor.
Agent sends full investigation on recovery — The webhook body should include instructions to skip diagnostics when status is "Up." Check that your webhook body has the recovery handling instruction.
Locked out of SSH after hardening — Access Proxmox through the web UI (https://your-proxmox-ip:8006), open Shell/Console, and either remove /etc/ssh/sshd_config.d/hardening.conf or set PasswordAuthentication yes back, then restart sshd.
Perl locale warnings during container install — Cosmetic. The install still works. Debian 13 containers often don't have locales generated.
Here's what we built:
The diagnostic script pattern is the core takeaway. The agent never runs arbitrary commands on your infrastructure. It reads structured output from deterministic scripts. Adding a new service means writing one script — the dispatcher, the webhook, and the agent all work without changes.
TIP
Yes, the WebChat interface is basic. In Part 3, we upgrade to Matrix — a self-hosted messaging platform with dedicated rooms, threaded investigations, and a proper chat interface. The investigation reports land in a room you can access from any device.
In Part 3, we deploy a Matrix homeserver (Continuwuity) and Element Web, connect OpenClaw as a Matrix bot, and migrate the investigation pipeline from WebChat to a proper messaging interface. Same diagnostic scripts, same webhook — just a better place for the reports to land.
.png)
.png)
.png)

Some links are affiliate links. I may earn a small commission at no extra cost to you.